
Concept explainers
Videos
a)
To determine: The optimal plan using the transportation method.
Introduction: Aggregate planning using transportation method helps to attain minimum cost using the optimal plan. The major advantage of transportation method is to achieve the optimal solution using optimal plans.
a)
Answer to Problem 17P
The optimal plan using the transportation method has been developed.
Explanation of Solution
Given information:
The following information has been given:
| Quarter |
| Regular time | Overtime | Subcontract |
| 1 | 500 | 400 | 80 | 100 |
| 2 | 750 | 400 | 80 | 100 |
| 3 | 900 | 800 | 160 | 100 |
| 4 | 450 | 400 | 80 | 100 |
Initial inventory is given as 250 units, regular time cost is $1 per unit, overtime cost is $1.50 per unit, and subcontract cost is $2 per unit. Carrying cost is given as $0.5 per unit per quarter and backorder cost is $0.5 per unit per quarter. Initial inventory would incur $0.2 per unit.
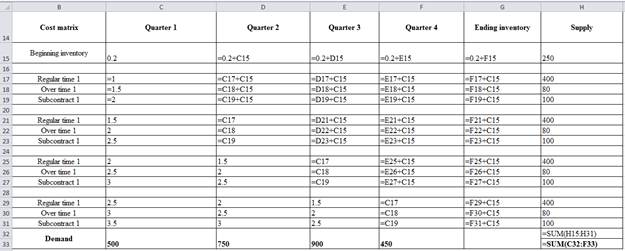
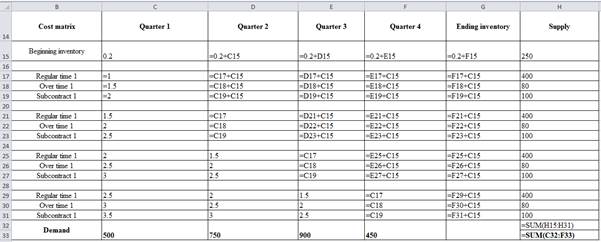
Develop optimal plan using transportation model:
Develop cost matrix:
| Cost matrix | Quarter 1 | Quarter 2 | Quarter 3 | Quarter 4 | Ending inventory | Supply |
| Beginning inventory | 0.2 | 0.4 | 0.6 | 0.8 | 1 | 250 |
| Regular time 1 | 1 | 1.2 | 1.4 | 1.6 | 1.8 | 400 |
| Over time 1 | 1.5 | 1.7 | 1.9 | 2.1 | 2.3 | 80 |
| Subcontract 1 | 2 | 2.2 | 2.4 | 2.6 | 2.8 | 100 |
| Regular time 1 | 1.5 | 1 | 1.2 | 1.4 | 1.6 | 400 |
| Over time 1 | 2 | 1.5 | 1.7 | 1.9 | 2.1 | 80 |
| Subcontract 1 | 2.5 | 2 | 2.2 | 2.4 | 2.6 | 100 |
| Regular time 1 | 2 | 1.5 | 1 | 1.2 | 1.4 | 400 |
| Over time 1 | 2.5 | 2 | 1.5 | 1.7 | 1.9 | 80 |
| Subcontract 1 | 3 | 2.5 | 2 | 2.2 | 2.4 | 100 |
| Regular time 1 | 2.5 | 2 | 1.5 | 1 | 1.2 | 400 |
| Over time 1 | 3 | 2.5 | 2 | 1.5 | 1.7 | 80 |
| Subcontract 1 | 3.5 | 3 | 2.5 | 2 | 2.2 | 100 |
| Demand | 500 | 750 | 900 | 450 | 2570 | |
| 2600 |
Excel worksheet to generate the above table:
Develop optimal plan:
| Optimal plan | Quarter 1 | Quarter 2 | Quarter 3 | Quarter 4 | Ending inventory | Dummy |
| Beginning inventory | 100 | 150 | ||||
| Regular time 1 | 400 | |||||
| Over time 1 | 80 | |||||
| Subcontract 1 | 100 | |||||
| Regular time 1 | 400 | |||||
| Over time 1 | 80 | |||||
| Subcontract 1 | 100 | |||||
| Regular time 1 | 800 | |||||
| Over time 1 | 40 | 100 | 20 | |||
| Subcontract 1 | 100 | |||||
| Regular time 1 | 400 | |||||
| Over time 1 | 50 | 30 | ||||
| Subcontract 1 | 100 | |||||
| Demand | 500 | 750 | 900 | 450 |
The given demand and supply should be separated and the remaining supply and demand should be used as a dummy value.
b)
To determine: The total cost of the optimal plan.
Introduction: Aggregate planning using transportation method helps to attain minimum cost using the optimal plan. The major advantage of transportation method is to achieve the optimal solution using optimal plans.
b)
Answer to Problem 17P
The optimal cost of the plan is $2,641.
Explanation of Solution
Given information:
The following information has been given:
| Quarter | Forecast (units) | Regular time | Overtime | Subcontract |
| 1 | 500 | 400 | 80 | 100 |
| 2 | 750 | 400 | 80 | 100 |
| 3 | 900 | 800 | 160 | 100 |
| 4 | 450 | 400 | 80 | 100 |
Initial inventory is given as 250 units, regular time cost is $1 per unit, overtime cost is $1.50 per unit, and subcontract cost is $2 per unit. Carrying cost is given as $0.5 per unit per quarter and backorder cost is $0.5 per unit per quarter. Initial inventory would incur $0.2 per unit.
Develop optimal plan using transportation model:
Develop cost matrix:
| Cost matrix | Quarter 1 | Quarter 2 | Quarter 3 | Quarter 4 | Ending inventory | Supply |
| Beginning inventory | 0.2 | 0.4 | 0.6 | 0.8 | 1 | 250 |
| Regular time 1 | 1 | 1.2 | 1.4 | 1.6 | 1.8 | 400 |
| Over time 1 | 1.5 | 1.7 | 1.9 | 2.1 | 2.3 | 80 |
| Subcontract 1 | 2 | 2.2 | 2.4 | 2.6 | 2.8 | 100 |
| Regular time 1 | 1.5 | 1 | 1.2 | 1.4 | 1.6 | 400 |
| Over time 1 | 2 | 1.5 | 1.7 | 1.9 | 2.1 | 80 |
| Subcontract 1 | 2.5 | 2 | 2.2 | 2.4 | 2.6 | 100 |
| Regular time 1 | 2 | 1.5 | 1 | 1.2 | 1.4 | 400 |
| Over time 1 | 2.5 | 2 | 1.5 | 1.7 | 1.9 | 80 |
| Subcontract 1 | 3 | 2.5 | 2 | 2.2 | 2.4 | 100 |
| Regular time 1 | 2.5 | 2 | 1.5 | 1 | 1.2 | 400 |
| Over time 1 | 3 | 2.5 | 2 | 1.5 | 1.7 | 80 |
| Subcontract 1 | 3.5 | 3 | 2.5 | 2 | 2.2 | 100 |
| Demand | 500 | 750 | 900 | 450 | 2570 | |
| 2600 |
Excel worksheet to generate the above table:
Develop optimal plan:
| Optimal plan | Quarter 1 | Quarter 2 | Quarter 3 | Quarter 4 | Ending inventory | Dummy |
| Beginning inventory | 100 | 150 | ||||
| Regular time 1 | 400 | |||||
| Over time 1 | 80 | |||||
| Subcontract 1 | 100 | |||||
| Regular time 1 | 400 | |||||
| Over time 1 | 80 | |||||
| Subcontract 1 | 100 | |||||
| Regular time 1 | 800 | |||||
| Over time 1 | 40 | 100 | 20 | |||
| Subcontract 1 | 100 | |||||
| Regular time 1 | 400 | |||||
| Over time 1 | 50 | 30 | ||||
| Subcontract 1 | 100 | |||||
| Demand | 500 | 750 | 900 | 450 |
The given demand and supply should be splitted and the remaining supply and demand should be used as a dummy value.
Calculate the total optimal cost:
It is calculated by adding the multiple of values in the optimal plan table and the value in the cost matrix to the respective value.
Hence, the total optimal cost is $2,641.
c)
To determine: The number of units remained unused in regular time capacity.
Introduction: Aggregate planning using transportation method helps to attain minimum cost using the optimal plan. The major advantage of transportation method is to achieve the optimal solution using optimal plans.
c)
Answer to Problem 17P
No, the regular time capacity remains unused.
Explanation of Solution
Given information:
The following information has been given:
| Quarter | Forecast (units) | Regular time | Overtime | Subcontract |
| 1 | 500 | 400 | 80 | 100 |
| 2 | 750 | 400 | 80 | 100 |
| 3 | 900 | 800 | 160 | 100 |
| 4 | 450 | 400 | 80 | 100 |
Initial inventory is given as 250 units, regular time cost is $1 per unit, overtime cost is $1.50 per unit, and subcontract cost is $2 per unit. Carrying cost is given as $0.5 per unit per quarter and backorder cost is $0.5 per unit per quarter. Initial inventory would incur $0.2 per unit.
Develop optimal plan:
| Optimal plan | Quarter 1 | Quarter 2 | Quarter 3 | Quarter 4 | Ending inventory | Dummy |
| Beginning inventory | 100 | 150 | ||||
| Regular time 1 | 400 | |||||
| Over time 1 | 80 | |||||
| Subcontract 1 | 100 | |||||
| Regular time 1 | 400 | |||||
| Over time 1 | 80 | |||||
| Subcontract 1 | 100 | |||||
| Regular time 1 | 800 | |||||
| Over time 1 | 40 | 100 | 20 | |||
| Subcontract 1 | 100 | |||||
| Regular time 1 | 400 | |||||
| Over time 1 | 50 | 30 | ||||
| Subcontract 1 | 100 | |||||
| Demand | 500 | 750 | 900 | 450 |
The given demand and supply should be separated and the remaining supply and demand should be used as a dummy value.
Determine whether the regular time capacity remain unused:
From the above table, it is clear that no regular time capacity remains unused. All the regular time capacity has been used in respective quarters.
d)
To determine: The extent of backordering in units and dollars.
Introduction: Aggregate planning using transportation method helps to attain minimum cost using the optimal plan. The major advantage of transportation method is to achieve the optimal solution using optimal plans.
d)
Answer to Problem 17P
The total unit of the backordered is 40 units and the total cost of producing the backorders are $20.
Explanation of Solution
Given information:
The following information has been given:
| Quarter | Forecast (units) | Regular time | Overtime | Subcontract |
| 1 | 500 | 400 | 80 | 100 |
| 2 | 750 | 400 | 80 | 100 |
| 3 | 900 | 800 | 160 | 100 |
| 4 | 450 | 400 | 80 | 100 |
Initial inventory is given as 250 units, regular time cost is $1 per unit, overtime cost is $1.50 per unit, and subcontract cost is $2 per unit. Carrying cost is given as $0.5 per unit per quarter and backorder cost is $0.5 per unit per quarter. Initial inventory would incur $0.2 per unit.
Develop optimal plan:
| Optimal plan | Quarter 1 | Quarter 2 | Quarter 3 | Quarter 4 | Ending inventory | Dummy |
| Beginning inventory | 100 | 150 | ||||
| Regular time 1 | 400 | |||||
| Over time 1 | 80 | |||||
| Subcontract 1 | 100 | |||||
| Regular time 1 | 400 | |||||
| Over time 1 | 80 | |||||
| Subcontract 1 | 100 | |||||
| Regular time 1 | 800 | |||||
| Over time 1 | 40 | 100 | 20 | |||
| Subcontract 1 | 100 | |||||
| Regular time 1 | 400 | |||||
| Over time 1 | 50 | 30 | ||||
| Subcontract 1 | 100 | |||||
| Demand | 500 | 750 | 900 | 450 |
The given demand and supply should be separated and the remaining supply and demand should be used as a dummy value.
Determine the extent backordering in units and dollars:
The colored cell is the only cell in the optimal plan, which is used for backordering. Hence, the backordering in units is 40 units. It is given that backorder cost is $0.50 per unit per quarter.
Hence, the total unit backordered is 40 units and the total costs of producing the backorders are $20.
Want to see more full solutions like this?
Chapter 13 Solutions
Principles Of Operations Management


- Jerusalem Medical Ltd., an Israeli producer of portable kidney dialysis units and other medical products, develops a 4-month aggregate plan. Demand and capacity (in units) are forecast as follows: Capacity Source Month 1 Month 2 Month 3 Month 4 Labor Regular time 245 265 300 300 Overtime 15 24 26 22 Subcontract 14 15 13 15 Demand 260 304 331 305 The cost of producing each dialysis unit is $875 on regular time, $1310 on overtime, and $1500 on a subcontract. Inventory carrying cost is $100 per unit per month. There is to be no beginning or ending inventory in stock and backorders are not permitted. Minimizing cost using the transportation method, the optimal cost is ???$ (enter your response as a whole number).arrow_forwardSpectrum Hair Salon is considering expanding itsbusiness, as it is experiencing a large growth. Th e question iswhether it should expand with a bigger facility than needed,hoping that demand will catch up, or with a small facility,knowing that it will need to reconsider expanding in three years.Th e management at Spectrum has estimated the followingchances for demand:• Th e likelihood of demand being high is 0.70.• Th e likelihood of demand being low is 0.30.Estimated profi ts for each alternative are as follows:• Large expansion has an estimated profi tability of either$100,000 or $70,000, depending on whether demand turnsout to be high or low.• Small expansion has a profi tability of $50,000, assuming thatdemand is low.• Small expansion with an occurrence of high demand wouldrequire considering whether to expand further. If thebusiness expands at this point, the profi tability is expected tobe $90,000. If it does not expand further, the profi tability isexpected to be $60,000.Draw a…arrow_forwardSpectrum Hair Salon is considering expanding itsbusiness, as it is experiencing a large growth. Th e question iswhether it should expand with a bigger facility than needed,hoping that demand will catch up, or with a small facility,knowing that it will need to reconsider expanding in three years.Th e management at Spectrum has estimated the followingchances for demand:• Th e likelihood of demand being high is 0.70.• Th e likelihood of demand being low is 0.30.Estimated profi ts for each alternative are as follows:• Large expansion has an estimated profi tability of either$100,000 or $70,000, depending on whether demand turnsout to be high or low.• Small expansion has a profi tability of $50,000, assuming thatdemand is low.• Small expansion with an occurrence of high demand wouldrequire considering whether to expand further. If thebusiness expands at this point, the profi tability is expected tobe $90,000. If it does not expand further, the profi tability isexpected to be $60,000.arrow_forward
- The president of Hill Enterprises, Terri Hill, projects the firm's aggregate demand requirements over the next 8 months as follows: January 1,400 May 2,200 February 1,600 June 2,200 March 1,800 July 1,800 April 1,800 August 1,400 Her operations manager is considering a new plan, which begins in January with 200 units of inventory on hand. Stockout cost of lost sales is $100 per unit. Inventory holding cost is $20 per unit per month. Ignore any idle-time costs. The plan is called plan C. Plan C: Keep a stable workforce by maintaining a constant production rate equal to the average gross requirements excluding initial inventory and allow varying inventory levels. Conduct your analysis for January through August. Part 2 The average monthly demand requirement=17751775 units. (Enter your response as a whole number.) Part 3 In order to arrive at the costs, first compute the ending inventory and stockout units for each month…arrow_forwardThe president of Hill Enterprises, Terri Hill, projects the firm's aggregate demand requirements over the next 8 months as follows: January 1,400 May 2,200 February 1,600 June 2,200 March 1,800 July 1,800 April 1,800 August 1,400 Her operations manager is considering a new plan, which begins in January with 200 units of inventory on hand. Stockout cost of lost sales is $100 per unit. Inventory holding cost is $20 per unit per month. Ignore any idle-time costs. The plan is called plan C. Plan C: Keep a stable workforce by maintaining a constant production rate equal to the average gross requirements excluding initial inventory and allow varying inventory levels. Conduct your analysis for January through August. Part 2 The average monthly demand requirement=1775 units. (Enter your response as a whole number.) Part 3 In order to arrive at the costs, first compute the ending inventory and stockout units for each month by…arrow_forwardThe president of Hill Enterprises, Terri Hill, projects the firm's aggregate demand requirements over the next 8 months as follows: January 1,400 May 2,200 February 1,600 June 2,200 March 1,800 July 1,800 April 1,800 August 1,400 Her operations manager is considering a new plan, which begins in January with 200 units of inventory on hand. Stockout cost of lost sales is $100 per unit. Inventory holding cost is $20 per unit per month. Ignore any idle-time costs. The plan is called plan C. Plan C: Keep a stable workforce by maintaining a constant production rate equal to the average gross requirements excluding initial inventory and allow varying inventory levels. Conduct your analysis for January through August. Part 2 The average monthly demand requirement=1775 units. (Enter your response as a whole number.) Part 3 In order to arrive at the costs, first compute the ending inventory and stockout units for each month by…arrow_forward
- Please do not give solution in image format thanku Bob's candle factory is considering three different manufacturing options. Option A uses hand labor with fixed costs of $10,000 and variable costs of $2.75/candle. Option B uses a combination of hand and automation with fixed costs of $15,000 and variable costs of $1.10/candle. Option C is highly automated with fixed costs of $20,000 and variable costs of $0.75/candle. a. If demand for Bob's candles is 2500, which option should he pick, and what is the cost? b. If demand for Bob's candles is 4500 which option should he pick, and what is the cost?arrow_forwardThe president of Hill Enterprises, Terri Hill, projects the firm's aggregate demand requirements over the next 8 months as follows: January 1,400 May 2,100 February 1,700 June 2,100 March 1,600 July 1,700 April 1,900 August 1,500 Her operations manager is considering a new plan, which begins in January with 200 units of inventory on hand. Stockout cost of lost sales is $60 per unit. Inventory holding cost is $20 per unit per month. Ignore any idle-time costs. Evaluate the following plans D and E. Plan D: Keep the current workforce stable at producing 1,600 units per month. In addition to the regular production, another 20% of the normal production units can be produced in overtime at an additional cost of $50 per unit. A warehouse now constrains the maximum allowable inventory on hand to 600 units or less. Note: Do not produce in overtime if production or inventory are adequate to cover demand.…arrow_forwardThe president of Hill Enterprises, Terri Hill, projects the firm's aggregate demand requirements over the next 8 months as follows: January 1,500 May 2,300 February 1,700 June 2,100 March 1,700 July 1,900 April 1,700 August 1,500 Her operations manager is considering a new plan, which begins in January with 200 units of inventory on hand. Stockout cost of lost sales is $125 per unit. Inventory holding cost is $20 per unit per month. Ignore any idle-time costs. The plan is called plan C. Plan C: Keep a stable workforce by maintaining a constant production rate equal to the average gross requirements excluding initial inventory and allow varying inventory levels. Conduct your analysis for January through August. The average monthly demand requirement=18001800 units. (Enter your response as a whole number.) In order to arrive at the costs, first compute the ending inventory and stockout units for each month by filling in…arrow_forward
- Jerusalem Medical Ltd., an Israeli producer of portable kidney dialysis units and other medical products, develops a 4-month aggregate plan. Demand and capacity (in units) are forecast as follows: Capacity Source Month 1 Month 2 Month 3 Month 4 Labor Regular time 245 275 280 300 Overtime 15 24 26 28 Subcontract 12 17 20 15 Demand 260 316 316 305 The cost of producing each dialysis unit is $985 on regular time, $1,310 on overtime, and $1,600 on a subcontract. Inventory carrying cost is $100 per unit per month. There is to be no beginning or ending inventory in stock and backorders are not permitted. Minimizing cost using the transportation method, the optimal cost is $nothing (enter your response as a whole number).arrow_forwardJerusalem Medical Ltd., an Israeli producer of portable kidney dialysis units and other medical products, develops a 4-month aggregate plan. Demand and capacity (in units) are forecast as follows: . Month 1 Month 2 Month 3 Month 4 Labor Regular time 225 265 280 300 Overtime 15 24 26 18 Subcontract 14 15 18 15 Demand 240 304 316 301 The cost of producing each dialysis unit is $875 on regular time, $1,310 on overtime, and $1,600 on a subcontract. Inventory carrying cost is $100 per unit per month. There is to be no beginning or ending inventory in stock and backorders are not permitted. Minimizing cost using the transportation method, the optimal cost is $enter your response here ______ (enter your response as a whole number).arrow_forwardSeveral years ago, River City built a water purification plant to remove toxins and filter the city’s drinkingwater. Because of population growth, the demand for water next year will be more than the plant’s capacity of 120 million gallons per year. Therefore, the city must expand the facility. The estimated demand over the next 20 years is given in Table 4.3. The city planning commission is considering three alternatives. - Alternative 1: Expand enough at the end of year 0 to last 20 years, which means an 80 million gallon increase (200 - 120). - Alternative 2: Expand at the end of year 0 and at theend of year 10. - Alternative 3: Expand at the end of years 0, 5, 10, and 15. Each alternative would provide the needed 200 million gallons per year at the end of 20 years, when the value of the plant would be the same regardless of the alternative chosen. Significant economies of scale can be achieved in construction costs: A 20-million-gallon expansion would cost $18 million; a…arrow_forward
 Practical Management ScienceOperations ManagementISBN:9781337406659Author:WINSTON, Wayne L.Publisher:Cengage,