Statistics for Business & Economics, Revised (MindTap Course List)
12th Edition
ISBN: 9781285846323
Author: David R. Anderson, Dennis J. Sweeney, Thomas A. Williams, Jeffrey D. Camm, James J. Cochran
Publisher: South-Western College Pub
bartleby

Videos

Textbook Question
Book Icon
Chapter 13, Problem 1CP

Wentworth Medical Center

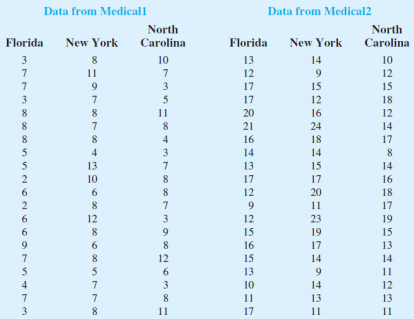
As part of a long-term study of individuals 65 years of age or older, sociologists and physicians at the Wentworth Medical Center in upstate New York investigated the relationship between geographic location and depression. A sample of 60 individuals, all in reasonably good health, was selected; 20 individuals were residents of Florida. 20 were residents of New York, and 20 were residents of North Carolina. Each of the individuals sampled was given a standardized test to measure depression. The data collected follow; higher test scores indicate higher levels of depression. These data are contained in the file Medical1.

A second part of the study considered the relationship between geographic location and depression for individuals 65 years of age or older who had a chronic health condition such as arthritis, hypertension, and/or heart ailment. A sample of 60 individuals with such conditions was identified. Again, 20 were residents of Florida, 20 were residents of New York, and 20 were residents of North Carolina. The levels of depression recorded for this study follow. These data are contained in the file named Medical2.

Chapter 13, Problem 1CP, Wentworth Medical Center As part of a long-term study of individuals 65 years of age or older,

Managerial Report

1. Use descriptive statistics to summarize the data from the two studies. what are your preliminary observations about the depression scores?

2. Use analysis of variance on both data sets. State the hypotheses being tested in each case. what are your conclusions?

3. Use inferences about individual treatment means where appropriate. what are your conclusions?

Blurred answer

Chapter 13 Solutions

Statistics for Business & Economics, Revised (MindTap Course List)

Ch. 13.2 - Four different paints are advertised as having the...Ch. 13.2 - The Consumer Reports Restaurant Customer...Ch. 13.3 - The following data arc from a completely...Ch. 13.3 - The following data are from a completely...Ch. 13.3 - To test whether the mean time needed to mix a...Ch. 13.3 - Refer to exercise 15. Use Fishers LSD procedure to...Ch. 13.3 - The following data are from an experiment designed...Ch. 13.3 - To lest for any significant difference in the...Ch. 13.3 - Refer to exercise 18. Use the Bonferroni...Ch. 13.3 - The International League of Triple-A minor league...Ch. 13.4 - Consider the experimental results for the...Ch. 13.4 - The following data were obtained for a randomized...Ch. 13.4 - An experiment has been conducted for four...Ch. 13.4 - An automobile dealer conducted a test to determine...Ch. 13.4 - The price drivers pay for gasoline often varies a...Ch. 13.4 - The Scholastic Aptitude Test (SAT) contains three...Ch. 13.4 - A study reported in the Journal of the American...Ch. 13.5 - A factorial experiment involving two levels of...Ch. 13.5 - The calculations for a factorial experiment...Ch. 13.5 - A mail-order catalog firm designed a factorial...Ch. 13.5 - An amusement park studied methods for decreasing...Ch. 13.5 - As part of a study designed to compare hybrid and...Ch. 13.5 - A study reported in The Accounting Review examined...Ch. 13 - In a completely randomized experimental design,...Ch. 13 - A study reported in the Journal of Small Business...Ch. 13 - The U.S. Environmental Protection Agency (EPA)...Ch. 13 - Prob. 37SECh. 13 - Prob. 38SECh. 13 - In a study conducted to investigate browsing...Ch. 13 - A research firm tests the miles-per-gallon...Ch. 13 - The compact car market in the United States is...Ch. 13 - Major League Baseball franchises rely on...Ch. 13 - A factorial experiment was designed to test for...Ch. 13 - A manufacturing company designed a factorial...Ch. 13 - Wentworth Medical Center As part of a long-term...Ch. 13 - Compensation for Sales Professionals Suppose that...
Knowledge Booster
Background pattern image
Statistics
Learn more about
Need a deep-dive on the concept behind this application? Look no further. Learn more about this topic, statistics and related others by exploring similar questions and additional content below.
Recommended textbooks for you
Text book image
Glencoe Algebra 1, Student Edition, 9780079039897...
Algebra
ISBN:9780079039897
Author:Carter
Publisher:McGraw Hill
Text book image
College Algebra (MindTap Course List)
Algebra
ISBN:9781305652231
Author:R. David Gustafson, Jeff Hughes
Publisher:Cengage Learning
Text book image
College Algebra
Algebra
ISBN:9781938168383
Author:Jay Abramson
Publisher:OpenStax
Hypothesis Testing using Confidence Interval Approach; Author: BUM2413 Applied Statistics UMP;https://www.youtube.com/watch?v=Hq1l3e9pLyY;License: Standard YouTube License, CC-BY
Hypothesis Testing - Difference of Two Means - Student's -Distribution & Normal Distribution; Author: The Organic Chemistry Tutor;https://www.youtube.com/watch?v=UcZwyzwWU7o;License: Standard Youtube License