
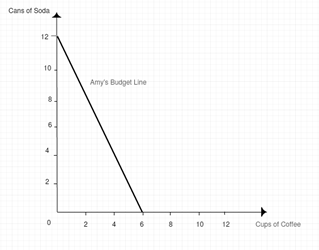
Total income of Amy is $12 a week. The price of coffee is $2 a cup and price of soda is $1 a cup. Create the graph of Amy's budget line. Can Amy consume the combination of 7 cans of soda and 2 cups of coffee a week or 7 cups of coffee and 2 cans of soda a week? Also, determine the relative price of a cup of coffee
Explanation of Solution
The budget line linear equation is:
The x-axis coordinate of budget line is: Income divided by price of Coffee: 6
The y-axis coordinate of budget line is: Income divided by price of Soda: 12
Amy's budget line is given below:
Now, with the different consumption bundles:
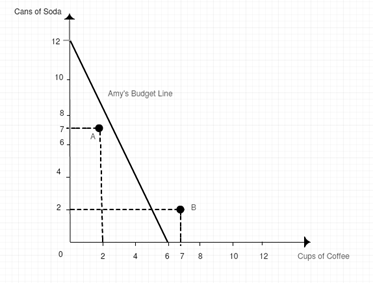
With 7 cans of soda and 2 cups of coffee, the total expenditure would be $11 which is less than total income of $12:
The consumer, Amy can afford this consumption bundle because the expenditure is less than income but some income is still saved. So, Amy can consume more of Soda cans or use it in other combination of consumption bundle so that her total expenditure is equal to total income.
Whereas, with 2 cans of Soda and 7 cups of coffee, the total expenditure would be $16 which is more than total income of $12:
So, Amy cannot afford this consumption bundle because its expenditure is more than her income level.
The first and second consumption bundles are shown in the diagram below as point A and point B, respectively.
The relative price of a cup of coffee is the price of coffee divided by price of a can of soda.
Therefore,
Budget Line: It is a graphical representation of a budget constraint of a consumer. The budget constraint is a linear equation which is the function of price of goods, income of the consumer and quantities consumed by the consumer. It is given below:
For two goods, the equation of budget line is:
Where,
'X' and 'Y' are the quantities of two goods.
Want to see more full solutions like this?
Chapter 13 Solutions
EBK FOUNDATIONS OF ECONOMICS

- Given that Tebogo's income is P1800, price of food is P30 and price of entertainment is P40. Draw Tebogo's budget linearrow_forwardHafidh’s income is $200 a month. The price of watch is $25 a show, and the price of a Jeans is $15. Calculate the equation for Hafidh’s budget line Draw a graph of Hafidh’s budget line with the quantity of Watches on the x-axis. If Hafidh’s income increased from $200 to 350$. Explain and show how Hafidh’s budget line changes with watches on the x-axis.arrow_forwardA consumer has initial income of $100 and faces prices of Px = $1 and Py = $5. Graph the budget line, and show how it changes when the price of good X increases to P1x = $5 .arrow_forward
- Tom has $ 300 to spend on two goods: A and B. Price of A is $3 and price of B is $5. Identify the combinations of the 2 goods that will lie to the right of Tom's budget line: A. 56 units of A and 25 units of B B. 29 units of A and 49 units of B C. 50 units of A and 29 units of B D. 40 units of A and 36 units of Barrow_forwardMarge also buys pizza for $10 and Pepsi for $2.She has income of $200. Her budget constraint willexperience a parallel outward shift ifa. the price of pizza falls to $5, the price of Pepsifalls to $1, and her income falls to $100.b. the price of pizza rises to $20, the price of Pepsirises to $4, and her income remains the same.c. the price of pizza falls to $8, the price of Pepsifalls to $1, and her income rises to $240.d. the price of pizza rises to $20, the price of Pepsirises to $4, and her income rises to $500arrow_forwardExplain how a consumer budget and product price changes impact the budget line by drawing hypothetical example budget lines.arrow_forward

 Economics (MindTap Course List)EconomicsISBN:9781337617383Author:Roger A. ArnoldPublisher:Cengage Learning

 Principles of MicroeconomicsEconomicsISBN:9781305156050Author:N. Gregory MankiwPublisher:Cengage Learning
 Principles of Microeconomics (MindTap Course List)EconomicsISBN:9781305971493Author:N. Gregory MankiwPublisher:Cengage Learning