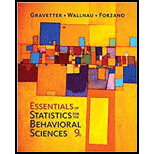
Essentials of Statistics for The Behavioral Sciences (MindTap Course List)
9th Edition
ISBN: 9781337098120
Author: Frederick J Gravetter, Larry B. Wallnau, Lori-Ann B. Forzano
Publisher: Cengage Learning
expand_more
expand_more
format_list_bulleted
Concept explainers
Textbook Question
Chapter 1.3, Problem 2LC
A research study comparing alcohol use for college students in the United States and Canada reports that more Canadian students drink but American students drink more (Kuo, Adlaf, Lee. Gliksman, Demers, & Wechsler. 2002).What research design did this study use?
- a.
Correlational - b. Experimental
- c. Nonexperimental
- d. Noncorrelational
Expert Solution & Answer
Want to see the full answer?
Check out a sample textbook solution
Chapter 1 Solutions
Essentials of Statistics for The Behavioral Sciences (MindTap Course List)
Ch. 1.1 - A researcher is interested in the fast-food eating...Ch. 1.1 - A researcher is curious about the average distance...Ch. 1.1 - What term is used for the statistical techniques...Ch. 1.1 - The SAT is standardized so that the average score...Ch. 1.2 - Prob. 1LCCh. 1.2 - A researcher studies the factors that determine...Ch. 1.2 - When measuring height to the nearest half inch,...Ch. 1.2 - Ranking a group of cities in terms of "quality of...Ch. 1.3 - In a correlational study, how many variables are...Ch. 1.3 - A research study comparing alcohol use for college...
Ch. 1.3 - A recent study reports that infant rats fed a diet...Ch. 1.4 - What value is represented by the uppercase letter...Ch. 1.4 - What is the value of (X + 1) for the following...Ch. 1.4 - What is the last step in the calculation of (X)2?...Ch. 1 - A researcher is interested in the texting habits...Ch. 1 - Define the terms population and sample, and...Ch. 1 - Statistical methods arc classified into two major...Ch. 1 - Define the terms statistic and parameter and...Ch. 1 - Explain why honesty is a hypothetical construct...Ch. 1 - A lax form asks people to identify their age....Ch. 1 - Four scales of measurement were introduced in this...Ch. 1 - Describe the data for a correlation research study...Ch. 1 - Describe how the goal of an experimental research...Ch. 1 - The results of a recent study showed that children...Ch. 1 - Gentile, Lynch, Linder, and Walsh (2004) surveyed...Ch. 1 - A research study comparing alcohol use for college...Ch. 1 - Stephens, Atkins, and Kingston (2009) conducted an...Ch. 1 - Ackerman and Goldsmith (2011) compared learning...Ch. 1 - There is some evidence that people with a visible...Ch. 1 - Guguen and Jacob (2012) asked waitresses to wear...Ch. 1 - Ford and Torok (2008) found that motivational...Ch. 1 - For the following scores, find the value of each...Ch. 1 - For the following set of scores, find the value of...Ch. 1 - For the following set of scores, find the value of...Ch. 1 - Two scores, X and Y, are recorded for each of n =...Ch. 1 - Use summation notation lo express each of the...Ch. 1 - For the following set of stores, find the value of...
Knowledge Booster
Learn more about
Need a deep-dive on the concept behind this application? Look no further. Learn more about this topic, statistics and related others by exploring similar questions and additional content below.Recommended textbooks for you
 Glencoe Algebra 1, Student Edition, 9780079039897...AlgebraISBN:9780079039897Author:CarterPublisher:McGraw Hill
 Big Ideas Math A Bridge To Success Algebra 1: Stu...AlgebraISBN:9781680331141Author:HOUGHTON MIFFLIN HARCOURTPublisher:Houghton Mifflin Harcourt

Glencoe Algebra 1, Student Edition, 9780079039897...
Algebra
ISBN:9780079039897
Author:Carter
Publisher:McGraw Hill

Big Ideas Math A Bridge To Success Algebra 1: Stu...
Algebra
ISBN:9781680331141
Author:HOUGHTON MIFFLIN HARCOURT
Publisher:Houghton Mifflin Harcourt
Correlation Vs Regression: Difference Between them with definition & Comparison Chart; Author: Key Differences;https://www.youtube.com/watch?v=Ou2QGSJVd0U;License: Standard YouTube License, CC-BY
Correlation and Regression: Concepts with Illustrative examples; Author: LEARN & APPLY : Lean and Six Sigma;https://www.youtube.com/watch?v=xTpHD5WLuoA;License: Standard YouTube License, CC-BY