Modern Business Statistics with Microsoft Office Excel (with XLSTAT Education Edition Printed Access Card) (MindTap Course List)
6th Edition
ISBN: 9781337115186
Author: David R. Anderson, Dennis J. Sweeney, Thomas A. Williams, Jeffrey D. Camm, James J. Cochran
Publisher: Cengage Learning
bartleby

Concept explainers

bartleby

Videos

Textbook Question
Book Icon
Chapter 13, Problem 34SE

In a completely randomized experimental design, three brands of paper towels were tested for their ability to absorb water. Equal-size towels were used, with four sections of towels tested per brand. The absorbency rating data follow. At a .05 level of significance, does there appear to be a difference in the ability of the brands to absorb water?

Chapter 13, Problem 34SE, In a completely randomized experimental design, three brands of paper towels were tested for their

Expert Solution & Answer
Check Mark
To determine

Check whether there is a significant difference in the ability of the brands to absorb water at α=0.05 level of significance.

Answer to Problem 34SE

Yes, there is a significant difference in the ability of the brands to absorb water.

Explanation of Solution

Calculation:

The data represent the absorbency rate for the three brands.

Assume that μ1, μ2, and μ3 denote the population means of three brands x, y, and z, respectively.

The test hypotheses are given below:

Null hypothesis:

H0:μ1=μ2=μ3

Alternative hypothesis:

Ha:At least one of the means is not equal.

It is given that the level of significance as 0.05.

One-way ANOVA:

Software procedure:

Step-by-step procedure to obtain one-way ANOVA using EXCEL:

  • Open the EXCEL.
  • Enter x, y, and z in different columns.
  • On Data tab in analysis group, click Data Analysis.
  • Select Anova: Single Factor.
  • Click OK.
  • Click in the Input Range box, select x, y, and z.
  • Click OK.

The output obtained using EXCEL software is shown below:

Modern Business Statistics with Microsoft Office Excel (with XLSTAT Education Edition Printed Access Card) (MindTap Course List), Chapter 13, Problem 34SE

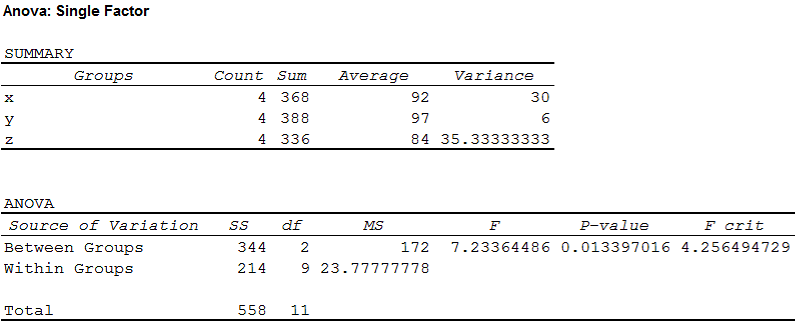
From the output, it is observed that the F-ratio is 7.23 and the p-value is 0.0134.

Decision:

If thep-valueα, reject the null hypothesis H0.

If thep-value>α, fail to reject the null hypothesis H0.

Conclusion:

Here, the p-value is less than the level of significance.

That is, p-value(=0.0134)<α(=0.05).

Therefore, the null hypothesis is rejected.

Hence, there is sufficient evidence to infer that there is a significant difference in the ability of the brands to absorb water.

Want to see more full solutions like this?

Subscribe now to access step-by-step solutions to millions of textbook problems written by subject matter experts!
Students have asked these similar questions
A trucking firm is considering the installation of a new, low-restriction engine air filter for its long-haul trucks, but doesn’t want to make the switch unless the new filter can be shown to improve the fuel economy of these vehicles. A test is set up in which each of 10 trucks makes the same run twice once with the old filtration system and once with the new version. Given the sample results shown below, use the 0.05 level of significance in determining whether the new filtration system could be superior. Truck Number Current Filter (mpg) New Filter (mpg) 1 7.6 7.3 2 4.1 7.2 3 10.4 6.8 4 6.9 10.6 5 5.6 8.8 6 7.9 8.7 7 5.4 5.7 8 5.7 8.7 9 5.5 8.9 10 5.3 7.1   Do reject or fail to reject H0?
A researcher reports an F-ratio with dfbetween = 2 and dfwithin = 30 for an independent-measures ANOVA.How many treatment conditions were compared in the experiment?How many subjects participated in the experiment?
Independent random samples of 32 people living on the west side of a city and 30 people living on the east side of a city were taken to determine if the income levels of west side residents are significantly different from the income levels of east side residents. Given the testing statistics below, determine if the data provides sufficient evidence to conclude that the income levels of west side residents are significantly different from the income levels of east side residents, at the 2% significance level. H0:μw=μeHa:μw≠μe t0=2.364 t0.01=±2.099 Select the correct answer below:   No; the test statistic is not between the critical values.   No; the test statistic is between the critical values.   Yes; the test statistic is not between the critical values.   Yes; the test statistic is between the critical values.

Chapter 13 Solutions

Modern Business Statistics with Microsoft Office Excel (with XLSTAT Education Edition Printed Access Card) (MindTap Course List)

Ch. 13.2 - Four different paints are advertised as having the...Ch. 13.2 - Restaurant Satisfaction. The Consumer Reports...Ch. 13.3 - The following data are from a completely...Ch. 13.3 - Prob. 14ECh. 13.3 - Testing Chemical Processes. To test whether the...Ch. 13.3 - Prob. 16ECh. 13.3 - Marketing Ethics. In the digital age of marketing,...Ch. 13.3 - Prob. 18ECh. 13.3 - Prob. 19ECh. 13.3 - Minor league Baseball Attendance. The...Ch. 13.4 - Consider the experimental results for the...Ch. 13.4 - Prob. 22ECh. 13.4 - 23. An experiment has been conducted for four...Ch. 13.4 - Prob. 24ECh. 13.4 - The price drivers pay for gasoline often varies a...Ch. 13.4 - SAT Performance. The Scholastic Aptitude Test...Ch. 13.4 - A study reported in the Journal of the American...Ch. 13.5 - A factorial experiment involving two levels of...Ch. 13.5 - Prob. 29ECh. 13.5 - Prob. 30ECh. 13.5 - Amusement Park Queues. An amusement park studied...Ch. 13.5 - Prob. 32ECh. 13.5 - Prob. 33ECh. 13 - In a completely randomized experimental design,...Ch. 13 - Prob. 35SECh. 13 - Prob. 36SECh. 13 - Prob. 37SECh. 13 - Assembly Methods. Three different assembly methods...Ch. 13 - In a study conducted to investigate browsing...Ch. 13 - Fuel Efficiency of Gasoline Brands. A research...Ch. 13 - Late-Night Talk Show Viewership. Jimmy Kimmel...Ch. 13 - Prob. 42SECh. 13 - Prob. 43SECh. 13 - Prob. 44SECh. 13 - CASE PROBLEM 1: WENTWORTH MEDICAL CENTER As part...Ch. 13 - CASE PROBLEM 2: COMPENSATION FOR SALES...Ch. 13 - TOURISTOPIA TRAVEL TourisTopia Travel (Triple T)...
Knowledge Booster
Background pattern image
Statistics
Learn more about
Need a deep-dive on the concept behind this application? Look no further. Learn more about this topic, statistics and related others by exploring similar questions and additional content below.
Recommended textbooks for you
Text book image
College Algebra (MindTap Course List)
Algebra
ISBN:9781305652231
Author:R. David Gustafson, Jeff Hughes
Publisher:Cengage Learning
Correlation Vs Regression: Difference Between them with definition & Comparison Chart; Author: Key Differences;https://www.youtube.com/watch?v=Ou2QGSJVd0U;License: Standard YouTube License, CC-BY
Correlation and Regression: Concepts with Illustrative examples; Author: LEARN & APPLY : Lean and Six Sigma;https://www.youtube.com/watch?v=xTpHD5WLuoA;License: Standard YouTube License, CC-BY