
Concept explainers
Videos
Reminder Round all answers to two decimal places unless otherwise indicated.
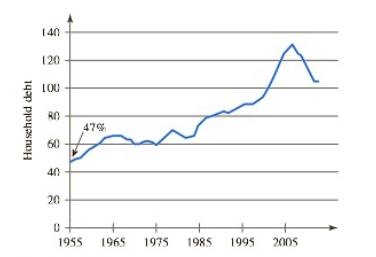
Household Debt The graph in Figure
a. Explain the meaning of
b. The graph reaches a maximum value. Estimate the maximum value and the year in which it occurred.
FIGURE
Want to see the full answer?
Check out a sample textbook solution
Chapter 1 Solutions
Functions and Change: A Modeling Approach to College Algebra (MindTap Course List)
Additional Math Textbook Solutions
High School Math 2015 Common Core Algebra 1 Student Edition Grade 8/9
Beginning and Intermediate Algebra (6th Edition)
College Algebra
Intermediate Algebra for College Students (7th Edition)
Algebra And Trigonometry (11th Edition)


- ReminderRound all answers to two decimal places unless otherwise indicated. InflationDuring a period of high inflation, a political leader was up for re-election. Inflation had been increasing during his administration, but he announced that the rate of increase of inflation was decreasing. Draw a graph of inflation versus time that illustrates this situation. Would this announcement convince you that economic conditions were improving?arrow_forwardReminder: Round all answer to two decimal places unless otherwise indicated. 15.Total Cost The total cost C for a manufacturer during a given time period is a function of the number N of items produced during that period. To deter mine a formula for the total cost, we need to know the manufacturers fixed costs covering things such as plant maintenance and insurance, as well as the cost for each unit produced, which is called the variable cost. To find the total cost, we multiply the variable cost by the number of items produced during that period and then add the fixed costs. Suppose that a manufacturer of widgets has fixed costs of 9000 per month and that the variable cost is 15 per widget so it costs 15 to produce 1 widget. a. Use a formula to express the total cost C of this manufacturer in a month as a function of the number of widgets produced in a month. Be sure to state the units you use. b. Express using functional notation the total cost if there are 250 widgets produced in a month, and then calculate that value.arrow_forwardReminderRound all answers to two decimal places unless otherwise indicated. Cutting TreesIn forestry management, it is important to know the net stumpage value of a stand that is, a group of trees. This is the commercial value of the trees minus the costs of felling, hauling, etc. The graph in Figure 1.39 shows the net stumpage value V, in dollars per acre, of a Douglas fir stand in the Pacific Northwest as a function of the age t, in years, of the stand. FIGURE 1.39 Net stumpage value of a Douglas Fir a. Estimate the net stumpage value of a Douglas fir 1 stand that is 60 years old. b. Estimate the age of a Douglas fir stand whose net stumpage value is 40,000peracre. c. At what age does the commercial value of the stand equal the costs of felling, hauling, etc.? d. At what age is the net stumpage value increasing the fastest? e. This graph shows V only up to age t=160years, but the Douglas fir lives for hundreds of years. Draw a graph to represent what you expect for V over the life span of the tree. Explain your reasoning.arrow_forward
- ReminderRound all answers to two decimal places unless otherwise indicated. Equilibrium PriceThis is a continuation of Exorcise 5. The equilibrium price is the price where the supply and demand are the same. In Figure 1.31, the supply curve is in red and the demand curve is in blue. Use this graph to estimate the equilibrium price. How many items are supplied at the equilibrium price? FIGURE 1.31 5. Supply and Demand CurvesA supply curve is a graph that shows the quantity of a product that is made available by suppliers as a function of the price. Similarly, a demand curve is a graph that shows the quantity of a product that consumers are willing to purchase as a function of the price. Examples of supply and demand curves are shown in Figures 1.29 and 1.30. a.Explain in practical terms what the supply curve in Figure 1.29 tells us. b.Explain in practical terms what the demand curve in Figure 1.30 tells us. FIGURE 1.29 A Supply curve FIGURE 1.30 A demand curvearrow_forwardReminder Round all answers to two decimal places unless otherwise indicated. Auto Loan Rates The graph in Figure 1.28 shows rates r for new car loans as a function of the date d. Explain in general terms the behavior of r(d) from 1980 to 2010.arrow_forwardReminderRound all answers to two decimal places unless otherwise indicated. Minimum WageOn July 24, 2008, the federal minimum wage was 6.55perhour. On July 24, 2009, this wage was raised to 7.25perhour. If W(t) denotes the minimum wage, in dollars per hour, as function of time, in years, use the given information to estimate dWdt in 2009.arrow_forward
- Reminder Round all answer to two decimal places unless otherwise indicated. Poverty in the United States Form 2000 through 2014, the percentage of Americans living below the poverty level is given approximately by 5 P=11.36+0.28t, Where t is the time, in years, since 2000. a. According to this model, what percentage of Americans lived below the poverty level in 2010? The actual number is 15.1.) b. What is the slope of this linear function? c. Explain in practical terms the meaning of the slope you found in part b.arrow_forwardReminderRound all answers to two decimal places unless otherwise indicated. Tornadoes In OklahomaThe graph in Figure 1.41 shows the number T=T(d) of tornadoes in Oklahoma Fl/EF1 and stronger reported by the National Climatic Data Center. Round your answers to the nearest whole number. a. When were the most tornadoes reported? How many were reported in that year? b. When were the fewest tornadoes reported? How many were reported in that year? c. What was the average yearly rate of decrease in tornadic activity from 2011 to 2012? d. What was the average yearly rate of increase in tornadic activity from 2009 to 2011? e. What was the average yearly rate of change that is, the average yearly rate of total increase or total decrease in tornadic activity from 2009 to 2012? FIGURE 1.41 Tornadoes in Oklahomaarrow_forwardReminder Round all answers to two decimal places unless otherwise indicated. Inflation The yearly inflation rate tells the percentage by which prices increase. For example, from 1990 through 2000, the inflation rate in the United States remained stable at amount 3 per year. In 1990, an individual retired on a fixed income of 36,000 per year. Assuming that the inflation rate remains at 3, determine how long it will take for the retirement income to deflate to half its 1990 value. Note: To say that retirement income has deflated to half its 1990 value means that prices have doubled.arrow_forward
- Reminder Round all answer to two decimal places unless otherwise indicated. Real Estate Sales A real estate agency has fixed monthly costs associated with rent, staff salaries, utilities, and supplies. It earns its money by taking a percentage commission on total real estate sales. During the month of July, the agency had total sales of 832,000 and showed a net income after paying fixed costs of 15,704. In August, total sales were 326,000 with a net income of only 532. a. Use a formula to express net income as a linear function of total sales. Be sure to identify what the letters that you use mean. b. Plot the graph of net income and identify the slope and vertical intercept. c. What are the real estate agencys fixed monthly costs? d. What percentage commission does the agency take on the sale of a home? e. Find the horizontal intercept and explain what this number means to the real estate agency.arrow_forwardReminder Round all answers to two decimal places unless otherwise indicated. World Copper Production World production of copper, in millions of tons per year, from 1900 to 2000 is given by C=0.51.033t, where t is the time in years since 1900. a.What production level does this model give for the year 2000? b.If this model were extended to 2025, how could you use your knowledge of copper production in 2024 to estimate copper production in 2025?arrow_forwardReminderRound all answers to two decimal places unless otherwise indicated. River FlowThe graph in Figure 1.37 shows the mean flow F for the Arkansas River, in cubic feet of water per second, as a function of the time t, in months, since the start of the year. The flow is measured near the rivers headwaters in the Rocky Mountains. a.Use functional notation to express the flow at the end of July, and then estimate that value. b.When is the flow at its greatest? c.At what time is the flow increasing the fastest? FIGURE 1.37 Flow for the Arkansas River d.Estimate the average rate of change per month in the flow during the first 2 months of the year. e.In light of the source of the Arkansas River, interpret your answers to parts b, c, and d.arrow_forward
 Functions and Change: A Modeling Approach to Coll...AlgebraISBN:9781337111348Author:Bruce Crauder, Benny Evans, Alan NoellPublisher:Cengage Learning