
Concept explainers
Videos
a.
Find the
Check whether a negative value of correlation coefficient is surprising or not.
Interpret the results.
a.
Answer to Problem 43CE
The
Explanation of Solution
Step-by-step procedure to obtain the correlation coefficient using MegaStat software:
- In an EXCEL sheet enter the data values of x and y.
- Go to Add-Ins > MegaStat > Correlation/Regression > Correlation matrix.
- Enter Input
Range as $A$1:$B$33. - Click on OK.
Output obtained using MegaStat is given as follows:
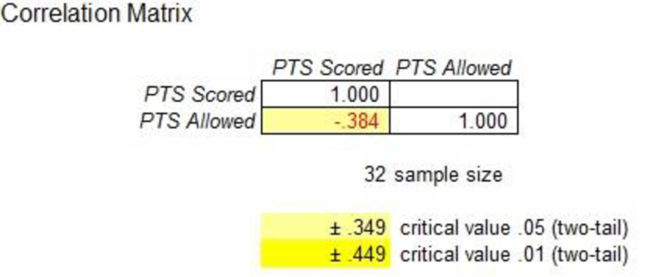
The correlation coefficient is –0.384. Since the correlation coefficient is negative, there is a moderate
b.
Find the value of coefficient of determination and explain the relationship.
b.
Answer to Problem 43CE
The coefficient of determination is 0.147.
Explanation of Solution
The coefficient of determination is the square of the correlation coefficient. From Part (a), the correlation coefficient is –0.384.
The coefficient of determination is as follows:
The value of coefficient of determination is 0.147. Therefore, 14.7% of variation in the dependent variable is explained by the independent variable.
c.
Test whether there is a negative association between the ‘point scored’ and ‘point allowed’ or not.
c.
Answer to Problem 43CE
There is enough evidence to infer that there is a negative association between the ‘point scored’ and ‘point allowed’.
Explanation of Solution
Denote the population correlation as
The hypotheses are given below:
Null hypothesis:
That is, the correlation between ‘point scored’ and ‘point allowed’ is greater than or equal to zero.
Alternative hypothesis:
That is, the correlation between ‘point scored’ and ‘point allowed’ is negative.
Test statistic:
The test statistic is as follows:
Here, the sample size is 32 and the correlation coefficient is –0.384.
The test statistic is as follows:
The degrees of freedom is as follows:
Thus, the level of significance is 0.05.
Critical value:
Software procedure:
Step-by-step software procedure to obtain the critical value using EXCEL software:
- Open an EXCEL file.
- In cell A1, enter the formula “=T.INV (0.05, 30)”.
Output obtained using the EXCEL is given as follows:
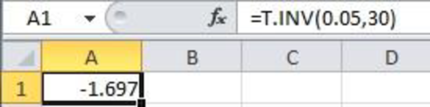
From the EXCEL output, the critical value is –1.697
Decision rule:
Reject the null hypothesis H0, if
Conclusion:
The value of test statistic is –2.28 and the critical value is –1.697.
Here,
By the rejection rule, reject the null hypothesis.
Thus, there is enough evidence to infer that there is a negative association between the ‘point scored’ and ‘point allowed’.
d.
Test whether there is a negative association between the ‘point scored’ and ‘point allowed’ for each conference or not.
d.
Answer to Problem 43CE
There is a negative association between the ‘point scored’ and ‘point allowed’ in conference AFC.
There is no evidence that a negative association between the ‘point scored’ and ‘point allowed’ in conference NFC.
Explanation of Solution
Denote the population correlation as
For conference AFC:
The hypotheses are given below:
Null hypothesis:
That is, the correlation between ‘point scored’ and ‘point allowed’ is greater than or equal to zero in conference AFC.
Alternative hypothesis:
That is, the correlation between ‘point scored’ and ‘point allowed’ is negative in conference AFC.
Step-by-step procedure to obtain the correlation coefficient using MegaStat software:
- In an EXCEL sheet enter the data values of x and y.
- Go to Add-Ins > MegaStat > Correlation/Regression > Correlation matrix.
- Enter Input Range as $A$1:$B$17.
- Click on OK.
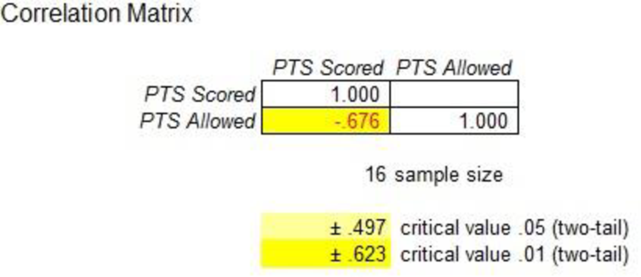
Output obtained using MegaStat is given as follows:
Test statistic:
The test statistic is as follows:
Here, the sample size is 16 and the correlation coefficient is –0.676.
The test statistic is as follows:
The degrees of freedom is as follows:
The level of significance is 0.05.
Critical value:
Software procedure:
Step-by-step software procedure to obtain the critical value using EXCEL software:
- Open an EXCEL file.
- In cell A1, enter the formula “=T.INV (0.05, 14)”.
Output obtained using EXCEL is given as follows:
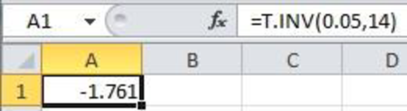
From the EXCEL output, the critical value is –1.761
Decision rule:
Reject the null hypothesis H0, if
Conclusion:
The value of test statistic is –3.432 and the critical value is –1.761.
Here,
By the rejection rule, reject the null hypothesis.
Thus, there is enough evidence to infer that there is a negative association between the ‘point scored’ and ‘point allowed’ in conference AFC.
For conference NFC:
The hypotheses are given below:
Null hypothesis:
That is, the correlation between ‘point scored’ and ‘point allowed’ is greater than or equal to zero in conference NFC.
Alternative hypothesis:
That is, the correlation between ‘point scored’ and ‘point allowed’ is a negative in conference NFC.
Step-by-step procedure to obtain the correlation coefficient using MegaStat software:
- In an EXCEL sheet enter the data values of x and y.
- Go to Add-Ins > MegaStat > Correlation/Regression > Correlation matrix.
- Enter Input Range as $A$1:$B$17.
- Click on OK.
Output obtained using MegaStat is given as follows:
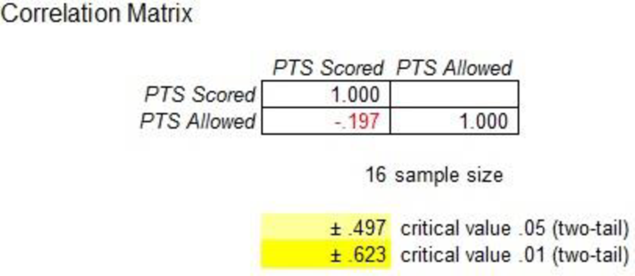
Test statistic:
The test statistic is as follows:
Here, the sample size is 16 and the correlation coefficient is –0.197.
The test statistic is as follows:
Conclusion:
The value of test statistic is –0.752 and the critical value is –1.761.
Here,
By the rejection rule, fail to reject the null hypothesis.
Thus, there is no enough evidence to infer that there is a negative association between the ‘point scored’ and ‘point allowed’ in conference NFC.
Want to see more full solutions like this?
Chapter 13 Solutions
EBK STATISTICAL TECHNIQUES IN BUSINESS


 Glencoe Algebra 1, Student Edition, 9780079039897...AlgebraISBN:9780079039897Author:CarterPublisher:McGraw Hill