
Essentials Of Statistics For Business & Economics
9th Edition
ISBN: 9780357045435
Author: David R. Anderson, Dennis J. Sweeney, Thomas A. Williams, Jeffrey D. Camm, James J. Cochran
Publisher: South-Western College Pub
expand_more
expand_more
format_list_bulleted
Videos
Textbook Question
Chapter 13, Problem 44SE
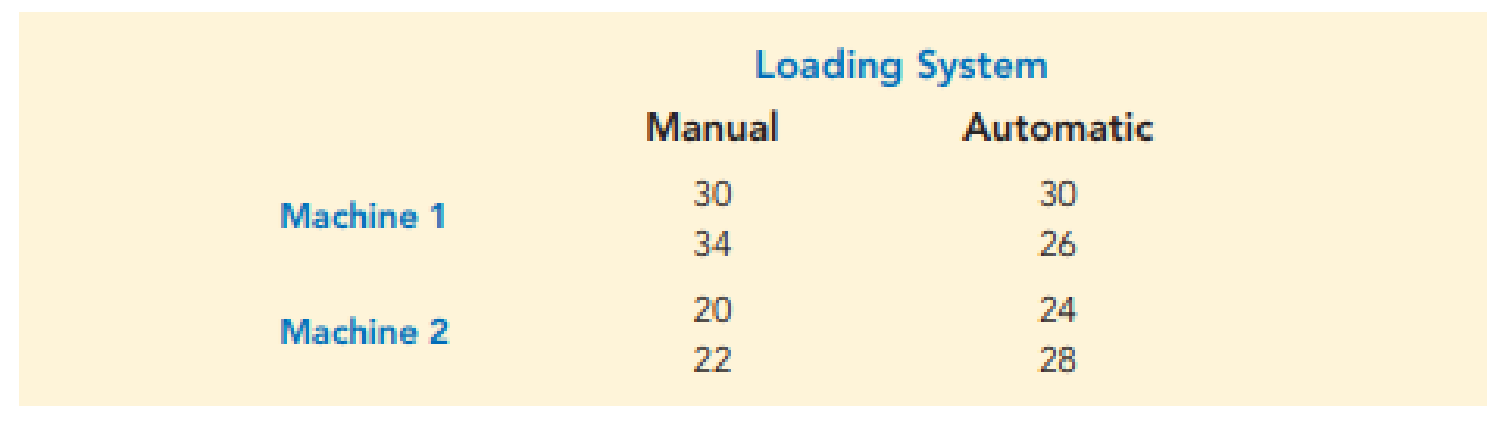
Defective Parts. A manufacturing company designed a factorial experiment to determine whether the number of defective parts produced by two machines differed and if the number of defective parts produced also depended on whether the raw material needed by each machine was loaded manually or by an automatic feed system. The following data give the numbers of defective parts produced. Use α = .05 to test for any significant effect due to machine, loading system, and interaction.
Expert Solution & Answer
Want to see the full answer?
Check out a sample textbook solution
Chapter 13 Solutions
Essentials Of Statistics For Business & Economics
Ch. 13.2 - The following data are from a completely...Ch. 13.2 - 2. In a completely randomized design, seven...Ch. 13.2 - 3. Refer to exercise 2.
what hypotheses are...Ch. 13.2 - 4. In an experiment designed to test the output...Ch. 13.2 - 5. In a completely randomized design, 12...Ch. 13.2 - Develop the analysis of variance computations for...Ch. 13.2 - 7. Three different methods for assembling a...Ch. 13.2 - 8. Refer to the NCP data in Table 13.4. Set up the...Ch. 13.2 - To study the effect of temperature on yield in a...Ch. 13.2 - Prob. 10E
Ch. 13.2 - Paint-Drying Robots. How long it takes paint to...Ch. 13.2 - Restaurant Satisfaction. The Consumer Reports...Ch. 13.3 - The following data are from a completely...Ch. 13.3 - The following data are from a completely...Ch. 13.3 - Testing Chemical Processes. To test whether the...Ch. 13.3 - Confidence Intervals for Different Processes....Ch. 13.3 - Marketing Ethics. In the digital age of marketing,...Ch. 13.3 - Machine Breakdowns. To test for any significant...Ch. 13.3 - Testing Time to Breakdown Between All Pairs of...Ch. 13.3 - Minor league Baseball Attendance. The...Ch. 13.4 - Consider the experimental results for the...Ch. 13.4 - Prob. 22ECh. 13.4 - An experiment has been conducted for four...Ch. 13.4 - Auto Tune-Ups. An automobile dealer conducted a...Ch. 13.4 - Airfares on Travel Websites. Are there differences...Ch. 13.4 - SAT Performance. The Scholastic Aptitude Test...Ch. 13.4 - Consumer Preferences. In 2018, consumer goods...Ch. 13.5 - A factorial experiment involving two levels of...Ch. 13.5 - The calculations for a factorial experiment...Ch. 13.5 - Mobile App Website Design. Based on a 2018 study,...Ch. 13.5 - Amusement Park Queues. An amusement park studied...Ch. 13.5 - Auto Fuel Efficiency. As part of a study designed...Ch. 13.5 - Tax Research. A study reported in The Accounting...Ch. 13 - Paper Towel Absorption. In a completely randomized...Ch. 13 - Job Satisfaction. A study reported in the Journal...Ch. 13 - Prob. 36SECh. 13 - College Attendance Rates. The following data show...Ch. 13 - Assembly Methods. Three different assembly methods...Ch. 13 - Job Automation. A Pew Research study conducted in...Ch. 13 - Fuel Efficiency of Gasoline Brands. A research...Ch. 13 - Late-Night Talk Show Viewership. Jimmy Kimmel...Ch. 13 - Golf Club Design. A major manufacturer of golf...Ch. 13 - Language Translation. A factorial experiment was...Ch. 13 - Defective Parts. A manufacturing company designed...Ch. 13 - CASE PROBLEM 1: WENTWORTH MEDICAL CENTER As part...Ch. 13 - CASE PROBLEM 2: COMPENSATION FOR SALES...Ch. 13 - TOURISTOPIA TRAVEL TourisTopia Travel (Triple T)...
Knowledge Booster


Learn more about
Need a deep-dive on the concept behind this application? Look no further. Learn more about this topic, statistics and related others by exploring similar questions and additional content below.Recommended textbooks for you
 Functions and Change: A Modeling Approach to Coll...AlgebraISBN:9781337111348Author:Bruce Crauder, Benny Evans, Alan NoellPublisher:Cengage Learning
 Holt Mcdougal Larson Pre-algebra: Student Edition...AlgebraISBN:9780547587776Author:HOLT MCDOUGALPublisher:HOLT MCDOUGAL
Functions and Change: A Modeling Approach to Coll...
Algebra
ISBN:9781337111348
Author:Bruce Crauder, Benny Evans, Alan Noell
Publisher:Cengage Learning
Holt Mcdougal Larson Pre-algebra: Student Edition...
Algebra
ISBN:9780547587776
Author:HOLT MCDOUGAL
Publisher:HOLT MCDOUGAL
Introduction to experimental design and analysis of variance (ANOVA); Author: Dr. Bharatendra Rai;https://www.youtube.com/watch?v=vSFo1MwLoxU;License: Standard YouTube License, CC-BY