
Videos
Curing concrete is known to be vulnerable to shock vibrations, which may cause cracking or hidden damage to the material. As part of a study of vibration phenomena, the paper “Shock Vibration Test of Concrete” (ACI Materials J., 2002: 361–370) reported the accompanying data on peak particle velocity (mm/sec) and ratio of ultrasonic pulse velocity after impact to that before impact in concrete prisms.
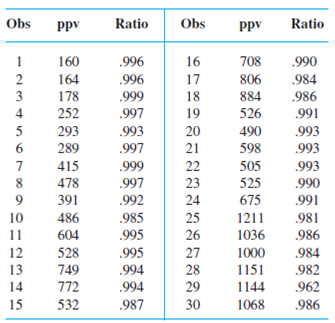
Transverse cracks appeared in the last 12 prisms, whereas there was no observed cracking in the first 18 prisms.
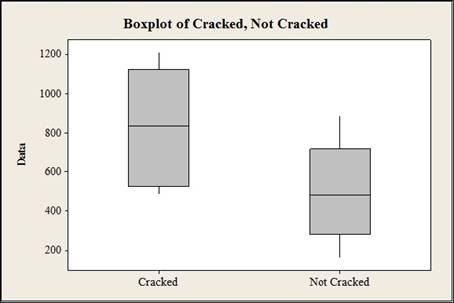
a. Construct a comparative boxplot of ppv for the cracked and uncracked prisms and comment. Then estimate the difference between true average ppv for cracked and uncracked prisms in a way that conveys information about precision and reliability.
b. The investigators fit the simple linear regression model to the entire data set consisting of 30 observations, with ppv as the independent variable and ratio as the dependent variable. Use a statistical software package to fit several different regression models, and draw appropriate inferences.
a.
Construct a comparative boxplot for the given data.
Answer to Problem 65SE
The comparative boxplot is given below:
Explanation of Solution
Given info:
The data shows the ultra sonic pulse velocity ratio before and after impact in concrete prisms for peak velocity. The first 18 observations shows the values before cracking and last 12 observations shows the values after cracking.
Calculation:
Comparative boxplot:
Software procedure:
Step by step procedure to construct the boxplot is given below:
- Choose Graph > Boxplot.
- Under Multiple Y's, choose Simple. Click OK.
- In Graph variables, enter the data of cracked and not cracked.
- Click OK.
Interpretation:
Thus, the box plot is constructed for the cracked ratio and not cracked ratio and the box plot suggests that the ultra sonic pulse velocity ratio for cracked ppv is greater than the ratio of not cracked ppv.
b.
Fit several different regression models and draw conclusions.
Answer to Problem 65SE
The simple linear regression model is given below:
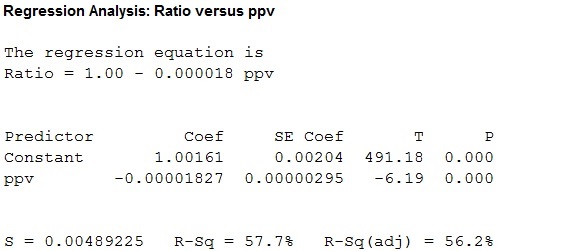
Figure 2
The multiple linear regression model is given below:
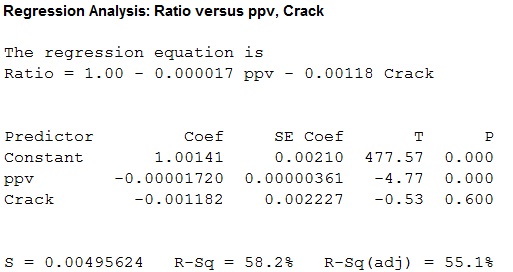
Figure 2
The multiple linear regression model with interaction is given below:
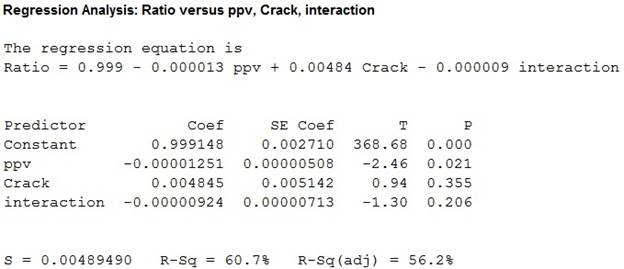
Figure 3
Explanation of Solution
Calculation:
Simple linear regression:
Software procedure:
Step by step procedure to fit a simple linear regression model is given below:
- Click Stat>Regression>Regression.
- Under Response (Y) select the column containing ratio.
- Under Predictor (X) select the column containing ppv.
- Click OK.
Interpretation:
Thus, a simple regression is fitted for the given data, the value of coefficient of determination is 57.7 which tells that the peak particle velocity can explain 57.7% of the variation in ratio of ultrasonic pulse velocity.
Multiple regression model with indicator variable (crack):
The new indicator variable is created by coding the observations with crack as 1 and observations without a crack as 0. Then the multiple regression model is built.
Software procedure:
Step by step procedure to fit a simple linear regression model is given below:
- Click Stat>Regression>Regression.
- Under Response (Y) select the column containing ratio.
- Under Predictor (X) select the column containing ppv, crack.
- Click OK.
Interpretation:
Thus, a multiple regression model is fitted for the given data , the value of coefficient of determination is 58.2 which tells that the peak particle velocity and crack can explain 58.2% of the variation in ratio of ultrasonic pulse velocity.
Multiple regression model with interaction between ppv and indicator variable (crack):
The indication variable is created by multiplying the ppv with indicator variable.
Software procedure:
Step by step procedure to fit a simple linear regression model is given below:
- Click Stat>Regression>Regression.
- Under Response (Y) select the column containing ratio.
- Under Predictor (X) select the column containing ppv, crack and interaction.
- Click OK.
Interpretation:
Thus, a multiple regression model with interaction between crack and ppv is fitted for the given data , the value of coefficient of determination is 60.7 which tells that the peak particle velocity, crack and interaction can explain 60.7% of the variation in ratio of ultrasonic pulse velocity.
The P- value for the individual t statistic corresponding to ppv and interaction are 0.355 and 0.206 which greater than the 5% level of significance.
Conclusion:
The simple linear, multiple linear model and multiple linear model with interaction gives almost the same
Want to see more full solutions like this?
Chapter 13 Solutions
Probability and Statistics for Engineering and the Sciences


- An article in Sensors and Actuators A: Physical [“Characterization and Simulation of Avalanche PhotoDiodes for Next-Generation Colliders” (2011, Vol. 172(1), pp. 181–188)] considered an avalanche photodiode (APD) to detect charged particles in a photo. The number of arrivals in each detection window was modeled with a Poisson distribution with a mean depending on the intensity of beam. For one beam intensity, the number of electrons arriving at an APD follows a Poisson dis- tribution with a mean of 1.74 particles per detection window of 200 nanoseconds. a. What is the mean and variance of the time for 100 arrivals?b. What is the probability that the time until the fifth particle arrives is greater than 1.0 nanosecond?arrow_forwardA golf tee manufacturer used a robot to hit balls off of their tee and a competitor's tee using the same club. Assume that 101balls were hit off each tee, and the data are suitable for inference. Is there evidence that balls hit off the manufacturer's tee have a higher initial velocity? (Assume a significance level of 0.05.) Distance (yards) Distance (yards) Ball Velocity (mph) Ball Velocity (mph) Club Velocity (mph) Club Velocity (mph) Avg. SD Avg. SD Avg. SD Competition 220.05 2.02 124.11 0.85 90.82 0.44 Manufacturer 222.28 2.57 125.37 0.41 90.82 0.44 a) Compute the t-statistic. t=_____ (Round to three decimal places as needed.) b)Compute the P-Value P-Value=_____ (Round to three decimal places as needed.)arrow_forwardA study was conducted to examine if children with autism spectrum disorder (ASD) had higher prenatal exposure to air pollution, specifically particulate matter < 2.5 g in diameter (PM2.5). Researchers obtained birth records of all children born in Los Angeles between 2000 and 2008 and linked these to the Department of Developmental Services records to determine if any of those subjects had been diagnosed with ASD or not. They used the birth addresses given in the birth records to determine the average daily PM2.5 for the third trimester for each child. The standard deviation for PM2.5 among ASD subjects was found to be 34.6 and for non-ASD subjects was 16.8. Assume PM2.5 is normally distributed. 4a. What was the study design? * Randomized Clinical Trial (RCT) * Case Report * Nested Case-Control Study * Case-Control Study * cross-sectional study Cohort Study 4B. What are the null and alternative hypotheses? 4c. What type of statistical test would you use to analyze the…arrow_forward
- An article in the Journal of Applied Polymer Science (Vol. 56, pp. 471–476, 1995) studied the effect of the mole ratio of sebacic acid on the intrinsic viscosity of copolyesters.- The data follows: Viscosity 0.45 0.2 0.34 0.58 0.7 0.57 0.55 0.44 Mole ratio 1 0.9 0.8 0.7 0.6 0.5 0.4 0.3 (a) Construct a scatter diagram of the data.arrow_forwardResearchers interested in lead exposure due to car exhaust sampled the blood of 52 police officers subjected to constant inhalation of automobile exhaust fumes while working traffic enforcement in a primarily urban environment. The blood samples of these officers had an average lead concentration of 124.32 µg/l and an SD of 37.74 µg/l; a previous study of individuals from a nearby suburb, with no history of exposure, found an average blood level concentration of 35 µg/l. Write down the hypotheses that would be appropriate for testing if the police officers appear to have been exposed to a higher concentration of lead. Explicitly state and check all conditions necessary for inference on these data. Test the hypothesis that the downtown police officers have a higher lead exposure than the group in the previous study. Interpret your results in context. Based on your preceding result, without performing a calculation, would a 99% confidence interval for the average blood concentration…arrow_forwardA researcher did a one-tailed one-sample t-test to test the hypothesis that babies prefer the color blue over the color red. He collected a sample of 26 babies and presented them with a red plastic star and a blue plastic start for 12 seconds. The researcher measured the amount of time each baby spent watching the blue star out of the 12 seconds. What is the critical t value, assuming the alpha level used was .05?arrow_forward
- Consider the accompanying data on flexural strength (MPa) for concrete beams of a certain type. 5.5 7.2 7.3 6.3 8.1 6.8 7.0 7.2 6.8 6.5 7.0 6.3 7.9 9.0 8.7 8.7 7.8 9.7 7.4 7.7 9.7 8.0 7.7 11.6 11.3 11.8 10.7 The data below give accompanying strength observations for cylinders. 6.6 5.8 7.8 7.1 7.2 9.2 6.6 8.3 7.0 8.4 7.3 8.1 7.4 8.5 8.9 9.8 9.7 14.1 12.6 11.3 Prior to obtaining data, denote the beam strengths by X1, . . . , Xm and the cylinder strengths by Y1, . . . , Yn. Suppose that the Xi's constitute a random sample from a distribution with mean μ1 and standard deviation σ1 and that the Yi's form a random sample (independent of the Xi's) from another distribution with mean μ2 and standard deviation σ2. Compute the estimated standard error. (Round your answer to three decimal places.) (c) Calculate a point estimate of the ratio σ1/σ2 of the two standard deviations. (Round your answer to three decimal places.) (d) Suppose a single beam and a single cylinder are…arrow_forwardONLY THE LAST ONE Consider the accompanying data on flexural strength (MPa) for concrete beams of a certain type. 5.9 7.2 7.3 6.3 8.1 6.8 7.0 7.5 6.8 6.5 7.0 6.3 7.9 9.0 8.4 8.7 7.8 9.7 7.4 7.7 9.7 8.2 7.7 11.6 11.3 11.8 10.7 The data below give accompanying strength observations for cylinders. 6.5 5.8 7.8 7.1 7.2 9.2 6.6 8.3 7.0 8.3 7.8 8.1 7.4 8.5 8.9 9.8 9.7 14.1 12.6 11.9 Prior to obtaining data, denote the beam strengths by X1, . . . , Xm and the cylinder strengths by Y1, . . . , Yn. Suppose that the Xi's constitute a random sample from a distribution with mean μ1 and standard deviation σ1 and that the Yi's form a random sample (independent of the Xi's) from another distribution with mean μ2 and standard deviation σ2. (a) Use rules of expected value to show that X − Y is an unbiased estimator of μ1 − μ2. E(X − Y) = E(X) − E(Y) = μ1 − μ2 E(X − Y) = E(X) − E(Y) 2 = μ1 − μ2 E(X − Y) = nm E(X) − E(Y) = μ1 − μ2 E(X −…arrow_forwardConsider the accompanying data on flexural strength (MPa) for concrete beams of a certain type. 5.3 7.2 7.3 6.3 8.1 6.8 7.0 7.1 6.8 6.5 7.0 6.3 7.9 9.0 9.0 8.7 7.8 9.7 7.4 7.7 9.7 7.9 7.7 11.6 11.3 11.8 10.7 The data below give accompanying strength observations for cylinders. 6.8 5.8 7.8 7.1 7.2 9.2 6.6 8.3 7.0 9.0 7.6 8.1 7.4 8.5 8.9 9.8 9.7 14.1 12.6 11.8 Prior to obtaining data, denote the beam strengths by X1, . . . , Xm and the cylinder strengths by Y1, . . . , Yn. Suppose that the Xi's constitute a random sample from a distribution with mean ?1 and standard deviation ?1 and that the Yi's form a random sample (independent of the Xi's) from another distribution with mean ?2 and standard deviation ?2. (a) Calculate the estimate for the given data. (Round your answer to three decimal places.) (b) Use rules of variance to obtain an expression for the variance and standard deviation (standard error) of the estimator in part (a). V(X − Y) = V(X) + V(Y) =…arrow_forward
- J 2 RCT was conducted to evaluate efficacy and safety of drug simvastatin compared to placebo in reducing mortality and morbidity in patients with coronary heart disease. Subjects were followed up on average 5.4 years. Over the duration of the follow-up, 63 subjects died due to heart attack among 2,223 subjects in the placebo group compared to 30 deaths among 2,221 patients in the simvastatin drug group. 1. What is the Relative Risk or death from the heart attack in the simvastatin group?arrow_forwardThe article “Monte Carlo Simulation—Tool for Better Understanding of LRFD” (J. of Structural Engr., 1993:1586–1599) suggests that yield strength (ksi) for A36 grade steel is normally distributed with a mean of 50.2 ksi and a standard deviation of 3.8 ksi. What is the probability that the yield strength is greater than 60? (Use 4 decimal places) Show the area of interest in the density curve.arrow_forwardAn article in Knee Surgery, Sports Traumatology, Arthroscopy, "Arthroscopic meniscal repair with an absorbable screw: results and surgical technique," (2005, Vol. 13, pp. 273-279) cites a success rate of 1% for meniscal tears with a rim width of less than 3 mm, and a 1% success rate for tears from 3-6 mm. If you are unlucky enough to suffer a meniscal tear of less than 3 mm on your left knee, and one of width 3-6 mm on your right knee, what is the probability that you have exactly one successful surgery? assume surgieries are independent.arrow_forward
 Glencoe Algebra 1, Student Edition, 9780079039897...AlgebraISBN:9780079039897Author:CarterPublisher:McGraw Hill