
Introduction To Statistics And Data Analysis
6th Edition
ISBN: 9781337793612
Author: PECK, Roxy.
Publisher: Cengage Learning,
expand_more
expand_more
format_list_bulleted
Concept explainers
Videos
Textbook Question
Chapter 13.1, Problem 11E
Consider the data and estimated regression line from the previous exercise.
- a. Calculate and interpret the value of r2.
- b. Calculate and interpret the value of se.
13.10 Hormone replacement therapy (HRT) is thought to increase the risk of breast cancer. The accompanying data on
x = Percent of women using HRT
and
y = Breast cancer incidence (cases per 100,000 women) for a region in Germany for 5 years appeared in the paper “Decline in Breast Cancer Incidence after Decrease in Utilisation of Hormone Replacement Therapy” (Epidemiology [2008]: 427–430). The authors of the paper used a simple linear regression model to describe the relationship between HRT use and breast cancer incidence.
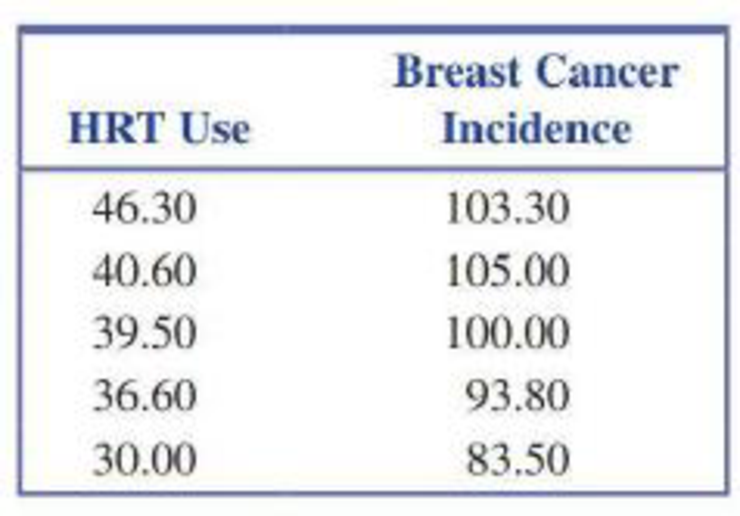
- a. What is the equation of the estimated regression line?
- b. What is the estimated average change in breast cancer incidence associated with a 1 percentage point increase in HRT use?
- c. What breast cancer incidence would be predicted in a year when HRT use was 40%?
- d. Should this regression model be used to predict breast cancer incidence for a year when HRT use was 20%? Explain.
Expert Solution & Answer
Want to see the full answer?
Check out a sample textbook solution
Students have asked these similar questions
Given below are results from the regression analysis where the dependent variable is the number of weeks a worker is unemployed due to a layoff (Unemploy) and the independent variables are the age of the worker (Age), the number of years of education received (Edu), the number of years at the previous job (Job Yr), a dummy variable for marital status (Married:
1=married,
0=otherwise),
a dummy variable for head of household (Head:
1=yes,
0=no)
and a dummy variable for management position (Manager:
1=yes,
0=no).
We shall call this Model 1. The coefficient of partial determination
(R2Yj.(All variables except j))
of each of the six predictors are, respectively, 0.2807, 0.0386, 0.0317, 0.0141, 0.0958, and 0.1201. Model 2 is the regression analysis where the dependent variable is Unemploy and the independent variables are Age and Manager. The results of the regression analysis are given. Refer to model 1. Which of the following is the correct null hypothesis to test…
In order to determine a realistic price for a new product that a company wants to market the company’s research department selected 10 sites thought to have essentially identical sales potential and offered the product in each at a different price. The resulting sales are recorded in the accompanying table:
Price ($)
Sales ($1,000s)
15.00
15
15.50
14
16.00
16
16.50
9
17.00
12
17.50
10
18.00
8
18.50
9
19.00
6
19.50
5
h). Estimate the slope of the actual equation of the regression line using a 95% confidence interval and interpret this interval.
In order to determine a realistic price for a new product that a company wants to market the company’s research department selected 10 sites thought to have essentially identical sales potential and offered the product in each at a different price. The resulting sales are recorded in the accompanying table:
Price ($)
Sales ($1,000s)
15.00
15
15.50
14
16.00
16
16.50
9
17.00
12
17.50
10
18.00
8
18.50
9
19.00
6
19.50
5
h). Estimate the slope of the actual equation of the regression line using a 95% confidence interval and interpret this interval using Minitab.
Chapter 13 Solutions
Introduction To Statistics And Data Analysis
Ch. 13.1 - Let x be the size of a house (in square feet) and...Ch. 13.1 - Consider the variables and population regression...Ch. 13.1 - The flow rate in a device used for air quality...Ch. 13.1 - The paper Predicting Yolk Height, Yolk Width,...Ch. 13.1 - A sample of small cars was selected, and the...Ch. 13.1 - Prob. 6ECh. 13.1 - Suppose that a simple linear regression model is...Ch. 13.1 - a. Explain the difference between the line y x...Ch. 13.1 - Prob. 9ECh. 13.1 - Hormone replacement therapy (HRT) is thought to...
Ch. 13.1 - Consider the data and estimated regression line...Ch. 13.1 - A simple linear regression model was used to...Ch. 13.1 - Consider the accompanying data on x = Advertising...Ch. 13.2 - What is the difference between and b? What is the...Ch. 13.2 - The largest commercial fishing enterprise in the...Ch. 13.2 - Prob. 16ECh. 13.2 - Prob. 17ECh. 13.2 - Prob. 18ECh. 13.2 - An experiment to study the relationship between x...Ch. 13.2 - The paper The Effects of Split Keyboard Geometry...Ch. 13.2 - The authors of the paper Decreased Brain Volume in...Ch. 13.2 - Do taller adults make more money? The authors of...Ch. 13.2 - Researchers studying pleasant touch sensations...Ch. 13.2 - Prob. 24ECh. 13.2 - Acrylamide is a chemical that is sometimes found...Ch. 13.2 - Prob. 26ECh. 13.2 - Exercise 13.18 described a regression analysis...Ch. 13.2 - Consider the accompanying data on x = Research and...Ch. 13.2 - Prob. 29ECh. 13.2 - In anthropological studies, an important...Ch. 13.3 - The graphs accompanying this exercise are based on...Ch. 13.3 - Prob. 32ECh. 13.3 - Prob. 33ECh. 13.3 - The article Vital Dimensions in Volume Perception:...Ch. 13.3 - Prob. 35ECh. 13.3 - An investigation of the relationship between x =...Ch. 13.4 - Prob. 37ECh. 13.4 - Prob. 38ECh. 13.4 - In Exercise 13.19, we considered a regression of y...Ch. 13.4 - Prob. 40ECh. 13.4 - A subset of data read from a graph that appeared...Ch. 13.4 - Prob. 42ECh. 13.4 - Prob. 43ECh. 13.4 - The article first introduced in Exercise 13.34 of...Ch. 13.4 - The shelf life of packaged food depends on many...Ch. 13.4 - For the cereal data of the previous exercise, the...Ch. 13.4 - The article Performance Test Conducted for a Gas...Ch. 13.5 - Prob. 48ECh. 13.5 - Prob. 49ECh. 13.5 - A sample of n = 353 college faculty members was...Ch. 13.5 - Prob. 51ECh. 13.5 - Prob. 52ECh. 13.5 - The accompanying summary quantities for x =...Ch. 13.5 - Prob. 54ECh. 13.5 - Prob. 55ECh. 13.6 - Prob. 56ECh. 13 - Prob. 1CRECh. 13 - Prob. 2CRECh. 13 - Prob. 3CRECh. 13 - Prob. 4CRECh. 13 - Prob. 5CRECh. 13 - The accompanying graphical display is similar to...Ch. 13 - Prob. 7CRECh. 13 - Prob. 8CRECh. 13 - Consider the following data on y = Number of songs...Ch. 13 - Many people take ginkgo supplements advertised to...Ch. 13 - Prob. 11CRECh. 13 - Prob. 12CRECh. 13 - Prob. 13CRECh. 13 - Prob. 14CRECh. 13 - The discharge of industrial wastewater into rivers...Ch. 13 - Many people take ginkgo supplements advertised to...Ch. 13 - It is hypothesized that when homing pigeons are...Ch. 13 - Prob. 18CRECh. 13 - Prob. 57CRCh. 13 - Prob. 58CRCh. 13 - Prob. 59CRCh. 13 - The article Photocharge Effects in Dye Sensitized...Ch. 13 - Prob. 61CRCh. 13 - Prob. 62CRCh. 13 - Prob. 63CRCh. 13 - Prob. 64CRCh. 13 - Prob. 65CRCh. 13 - The article Improving Fermentation Productivity...Ch. 13 - Prob. 67CRCh. 13 - Prob. 68CRCh. 13 - Prob. 69CR
Knowledge Booster


Learn more about
Need a deep-dive on the concept behind this application? Look no further. Learn more about this topic, statistics and related others by exploring similar questions and additional content below.Similar questions
- Olympic Pole Vault The graph in Figure 7 indicates that in recent years the winning Olympic men’s pole vault height has fallen below the value predicted by the regression line in Example 2. This might have occurred because when the pole vault was a new event there was much room for improvement in vaulters’ performances, whereas now even the best training can produce only incremental advances. Let’s see whether concentrating on more recent results gives a better predictor of future records. (a) Use the data in Table 2 (page 176) to complete the table of winning pole vault heights shown in the margin. (Note that we are using x=0 to correspond to the year 1972, where this restricted data set begins.) (b) Find the regression line for the data in part ‚(a). (c) Plot the data and the regression line on the same axes. Does the regression line seem to provide a good model for the data? (d) What does the regression line predict as the winning pole vault height for the 2012 Olympics? Compare this predicted value to the actual 2012 winning height of 5.97 m, as described on page 177. Has this new regression line provided a better prediction than the line in Example 2?arrow_forwardThe following fictitious table shows kryptonite price, in dollar per gram, t years after 2006. t= Years since 2006 0 1 2 3 4 5 6 7 8 9 10 K= Price 56 51 50 55 58 52 45 43 44 48 51 Make a quartic model of these data. Round the regression parameters to two decimal places.arrow_forwardFor the following exercises, use Table 4 which shows the percent of unemployed persons 25 years or older who are college graduates in a particular city, by year. Based on the set of data given in Table 5, calculate the regression line using a calculator or other technology tool, and determine the correlation coefficient. Round to three decimal places of accuracyarrow_forward
arrow_back_ios
arrow_forward_ios
Recommended textbooks for you
 College AlgebraAlgebraISBN:9781305115545Author:James Stewart, Lothar Redlin, Saleem WatsonPublisher:Cengage Learning
 Algebra and Trigonometry (MindTap Course List)AlgebraISBN:9781305071742Author:James Stewart, Lothar Redlin, Saleem WatsonPublisher:Cengage Learning
 Algebra & Trigonometry with Analytic GeometryAlgebraISBN:9781133382119Author:SwokowskiPublisher:Cengage
 Functions and Change: A Modeling Approach to Coll...AlgebraISBN:9781337111348Author:Bruce Crauder, Benny Evans, Alan NoellPublisher:Cengage Learning
 Glencoe Algebra 1, Student Edition, 9780079039897...AlgebraISBN:9780079039897Author:CarterPublisher:McGraw Hill
College Algebra
Algebra
ISBN:9781305115545
Author:James Stewart, Lothar Redlin, Saleem Watson
Publisher:Cengage Learning
Algebra and Trigonometry (MindTap Course List)
Algebra
ISBN:9781305071742
Author:James Stewart, Lothar Redlin, Saleem Watson
Publisher:Cengage Learning
Algebra & Trigonometry with Analytic Geometry
Algebra
ISBN:9781133382119
Author:Swokowski
Publisher:Cengage
Functions and Change: A Modeling Approach to Coll...
Algebra
ISBN:9781337111348
Author:Bruce Crauder, Benny Evans, Alan Noell
Publisher:Cengage Learning
Glencoe Algebra 1, Student Edition, 9780079039897...
Algebra
ISBN:9780079039897
Author:Carter
Publisher:McGraw Hill
Correlation Vs Regression: Difference Between them with definition & Comparison Chart; Author: Key Differences;https://www.youtube.com/watch?v=Ou2QGSJVd0U;License: Standard YouTube License, CC-BY
Correlation and Regression: Concepts with Illustrative examples; Author: LEARN & APPLY : Lean and Six Sigma;https://www.youtube.com/watch?v=xTpHD5WLuoA;License: Standard YouTube License, CC-BY