
Concept explainers
Videos
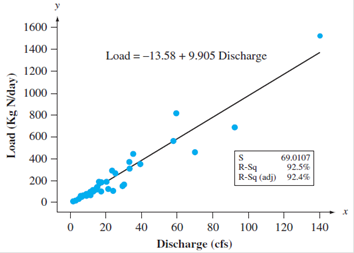
The accompanying scatterplot is based on data provided by authors of the article “Spurious
| Full sample | (140,152935) deleted | |
| 9.9050 | 8.8241 | |
| .3806 | .4734 |
Does this observation appear to have had a substantial impact on the estimated slope? Explain.

Trending nowThis is a popular solution!

Chapter 13 Solutions
Probability and Statistics for Engineering and the Sciences


- CONSIDER that the data is CORRELATED use alpha .05. Provide the following: 1. CI of the F value 2. Statistical Interpretationarrow_forwardA group of 13 health children and adolescents participated in a study designed to analyze the relationship between age (AGE in years) and average total sleep time (ATST in minutes). To obtain a measure for ATST, recordings were taken on each subject on three consecutive nights and then averaged . The results obtained are given below along with the corresponding scatter plot. AGE ATST 1. 4.40 586.00 2. 14.00 461.75 3. 10.10 491.10 4. 6.70 565.00 5. 11.50 462.00 6. 9.60 532.10 7. 12.40 477.60 8. 8.90 515.20 9. 11.10 493.00 10. 7.75 528.30 11. 5.50 575.90 12. 8.60 532.50 13. 7.20 530.50 A simple linear regression model was fit to the data in R. The results are given below. Call: lm(formula = ATST ~ AGE) Residuals: Min 1Q Median 3Q Max -23.011 -9.365 2.372 6.770 20.411 Coefficients: Estimate Std. Error t value Pr(>|t|) (Intercept) 646.483 12.918…arrow_forwardA suburban hotel derives its revenue from its hotel and restaurant operations. Theowners are interested in the relationship between the number of rooms occupied on anightly basis and the revenue per day in the restaurant. Below is a sample of 25 days(Monday through Thursday) from last year showing the restaurant income and numberof rooms occupied.arrow_forward
- Listed below are paired data consisting of waist size in centimeters and Body Mass Index BMI from a random sample of 20 adult men selected from the population. At the a = 0.05 significance level, test the claim that there is positive linear correlation between waist size and Body Mass Indices in adult men, by answering questions a. thru e. below. That is, test the claim: ρ>0 This uses a Null Hypothesis of ρ =0 and an Alternative Hypothesis of ρ>0 WAIST BMI 120.4 33.3 107.8 28.0 120.3 45.4 97.2 28.4 95.1 25.9 112.0 31.1 78.0 20.1 103.5 32.7 89.7 25.8 112.0 36.5 95.0 25.8 115.3 34.5 118.8 37.4 92.6 26.1 75.5 19.3 101.8 29.9 92.5 27.4 100.8 31.4 82.8 21.0 92.9 28.5 a. What is the linear correlation coefficient r = ___________________________ b. What is the P-Value…arrow_forwardA group of 13 health children and adolescents participated in a study designed to analyze the relationship between age (AGE in years) and average total sleep time (ATST in minutes). To obtain a measure for ATST, recordings were taken on each subject on three consecutive nights and then averaged. The results obtained are given below along with the corresponding scatter plot. Age ATST 4.4 586 14 461.75 10.1 491.1 6.7 565 11.5 462 9.6 532.1 12.4 477.6 8.9 515.2 11.1 493 7.75 528.3 5.5 575.9 8.6 532.5 7.2 530.5 Estimated regression line: y-hat = 648.483 - 14.041x Suppose that a new subject is added to the study data and that subject is 12.5 years old with an AST of 580 minutes. IF the regression model were to be refit with this additional data point, would the new slope be greater or less than -14.041? Justify your response.arrow_forwardCONSIDER that the data is UNCORRELATED use alpha .05. Provide the following: 1. CI of the F value 2. Statistical Interpretationarrow_forward
- Managers of an outdoor coffee stand in Coast City are examining the relationship between (hot) coffee sales and daily temperature, hoping to be able to predict a day's total coffee sales from the maximum temperature that day. The bivariate data values for the coffee sales (denoted by , in dollars) and the maximum temperature (denoted by , in degrees Fahrenheit) for each of fifteen randomly selected days during the past year are given below. These data are plotted in the scatter plot in Figure 1.arrow_forwardRecently, researchers have begun to focus on the relationship between potentially toxic environmental exposures in children to a number of adverse health outcomes. Suppose one such researcher wants to investigate the relationship between lead levels in soil (micrograms/dL) and BMI (kg/m2). The following table represents a SRS of households with the corresponding exterior lead levels and BMI of a randomly sampled child in the home. Lead levels BMI 13.6 19.7 14.3 19.9 9.7 20.1 9.4 22.1 11.4 19.8 10.9 21.6 A) Write out the null and alternative hypotheses for a formal test of significance testing the correlation between the two variables and calulate a t statistic and interpret your pvalue and results.arrow_forwardA new drug for pain relief is being tested within a given palliative care population. The new drug is being compared to an already approved pain relief drug that is commonly used in providing palliative care to patients who experience chronic severe pain. Assume the patients are asked to rate the pain on a scale from 1 to 10, and the data presented below was obtained from a small study designed to compare the effectiveness of the two drugs. Set up and interpret the results of a Mann-Whitney U test with an alpha of .05. Pain Rating as Reported by Patients Old Drug 1 2 2 4 6 New Drug 1 2 2 3 7 Old Drug New Drug Total Sample (Ordered Smallest to Largest) Ranks Old Drug New Drug Old Drug New Drug 1 1 1 1 1.5 1.5 2 2 2 2 4.5 4.5 2 2 2 2 4.5 4.5 4 3 3 7 6 7 4 8 6…arrow_forward
- A new drug for pain relief is being tested within a given palliative care population. The new drug is being compared to an already approved pain relief drug that is commonly used in providing palliative care to patients who experience chronic severe pain. Assume the patients are asked to rate the pain on a scale from 1 to 10, and the data presented below was obtained from a small study designed to compare the effectiveness of the two drugs. Set up and interpret the results of a Mann-Whitney U test with an alpha of .05. Pain Rating as Reported by Patients Old Drug 1 3 3 4 6 New Drug 1 2 3 3 7arrow_forwardA new drug for pain relief is being tested within a given palliative care population. The new drug is being compared to an already approved pain relief drug that is commonly used in providing palliative care to patients who experience chronic severe pain. Assume the patients are asked to rate the pain on a scale from 1 to 10, and the data presented below was obtained from a small study designed to compare the effectiveness of the two drugs. Set up and interpret the results of a Mann-Whitney U test with an alpha of .05. Pain Rating as Reported by PatientsOld Drug 1 2 2 4 6 New Drug 1 2 2 3 7Old Drug New Drug Total Sample(Ordered Smallest to Largest) RanksOld Drug New Drug Old Drug New DrugR1= R2= A) We reject H0 in favor of H1, which states the two populations are not equal at the alpha equals .05 level because the calculated U value of 12.5 is greater than the critical U value of 2.B) We reject H0 in favor of H1, which states the two populations are not equal at the alpha equals .05…arrow_forwardA new drug for pain relief is being tested within a given palliative care population. The new drug is being compared to an already approved pain relief drug that is commonly used in providing palliative care to patients who experience chronic severe pain. Assume the patients are asked to rate the pain on a scale from 1 to 10, and the data presented below was obtained from a small study designed to compare the effectiveness of the two drugs. Set up and interpret the results of a Mann-Whitney U test with an alpha of .05. Pain Rating as Reported by Patients Old Drug 1 3 3 4 6 New Drug 1 2 3 3 7 Old Drug New Drug Total Sample (Ordered Smallest to Largest) Ranks Old Drug New Drug Old Drug New Drug…arrow_forward
 MATLAB: An Introduction with ApplicationsStatisticsISBN:9781119256830Author:Amos GilatPublisher:John Wiley & Sons Inc
 Probability and Statistics for Engineering and th...StatisticsISBN:9781305251809Author:Jay L. DevorePublisher:Cengage Learning
 Statistics for The Behavioral Sciences (MindTap C...StatisticsISBN:9781305504912Author:Frederick J Gravetter, Larry B. WallnauPublisher:Cengage Learning
 Elementary Statistics: Picturing the World (7th E...StatisticsISBN:9780134683416Author:Ron Larson, Betsy FarberPublisher:PEARSON
 The Basic Practice of StatisticsStatisticsISBN:9781319042578Author:David S. Moore, William I. Notz, Michael A. FlignerPublisher:W. H. Freeman
 Introduction to the Practice of StatisticsStatisticsISBN:9781319013387Author:David S. Moore, George P. McCabe, Bruce A. CraigPublisher:W. H. Freeman