
Videos
The largest commercial fishing enterprise in the southeastern United States is the harvest of shrimp. In a study described in the paper “Long-term Trawl Monitoring of White Shrimp, Litopenaeus setiferus (Linnaeus), Stocks within the ACE Basin National Estuariene Research Reserve, South Carolina“ (Journal of Coastal Research [2008]: 193–199), researchers monitored variables thought to be related to the abundance of white shrimp.
One variable the researchers thought might be related to abundance is the amount of oxygen in the water. The relationship between the mean number of white shrimp caught in a single outing and oxygen saturation was described by fitting a regression line using data from 10 randomly selected offshore sites. Computer output is shown below.
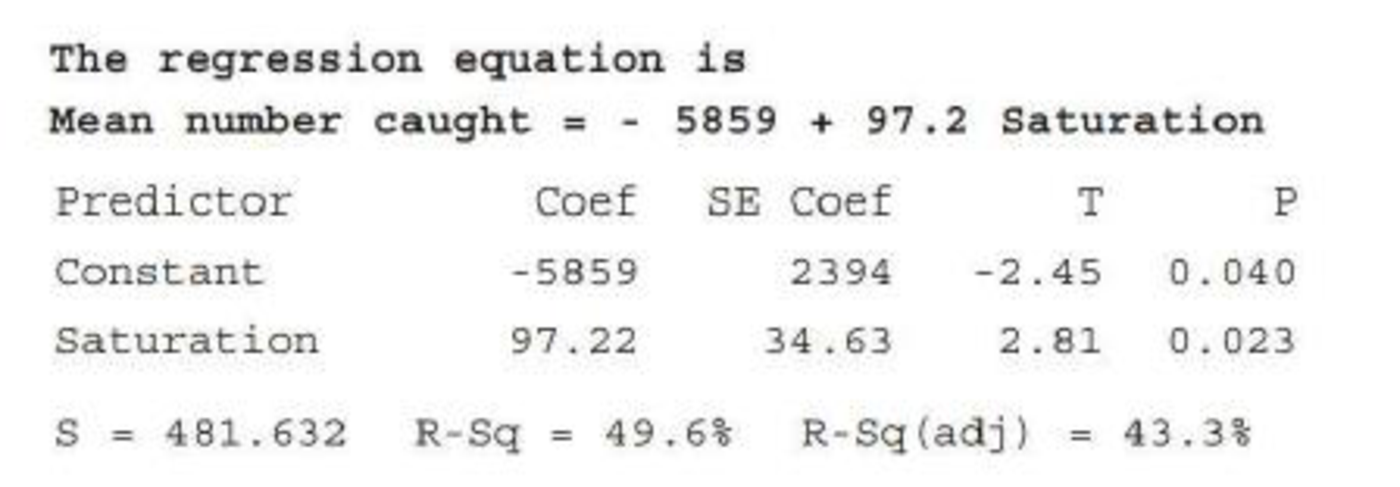
- a. Is there convincing evidence of a useful linear relationship between the mean number of shrimp caught and oxygen saturation? Explain. (Hint: See Example 13.5.)
- b. Is the relationship strong? Explain why or why not.
- c. Construct a 95% confidence interval for β and interpret it in context. (Hint: See Example 13.4.)

Trending nowThis is a popular solution!

Chapter 13 Solutions
Introduction To Statistics And Data Analysis


- NutritionResearchers compared protein intake among threegroups of postmenopausal women: (1) women eating astandard American diet (STD), (2) women eating a lactoovo-vegetarian diet (LAC), and (3) women eating a strictvegetarian diet (VEG). The mean ± 1 sd for protein intake(mg) is presented in Table 12.29. 12.5 Using the data in Table 12.29, perform a multiplecomparisons procedure to identify which specific underlyingmeans are different.arrow_forwardKnight and Haslam (2010) found that office workers who had some input into the design of their office space were more productive and had higher well-being compared to workers for whom the office design was completely controlled by an office manager. For this study, identify the independent variable and the dependent variablearrow_forwardSuppose that, as part of a research methods class, Bailey was asked to write a summary of a research paper on the topic of the effects of oil contamination in soil on seed germination rates. Identify the explanatory and the response variables.arrow_forward
- An automotive engineer is investigating two different types of metering devices for an electronic fuel injection system to determine whether they differ in their fuel mileage performance. The system is installed on 10 different cars, and a test is run with each metering device on each car. The data is provided below: Metering Device Car 1 2 1 17.6 16.8 2 19.4 20.0 3 18.2 17.6 4 17.1 16.4 5 15.3 16.0 6 15.9 15.9 7 16.3 16.5 8 18.0 18.4 9 17.3 16.4 10 19.1 20.1 Is there a significant difference between the means of the two metering devices? Use . Interpret the result in the context of the problem. An article in the journal Hazardous Waste and Hazardous Materials (Vol. 6, 1989) reported the results of an analysis of the weight of calcium in standard cement and cement doped with lead. Reduced levels of calcium would indicate that the hydration mechanism in the cement is blocked…arrow_forwardA consumer advocacy group wanted to study whether different airline carriers differed in terms of their delayed flights. In particular, the researchers were interested in the relationship between p1, the proportion of Alpha Airlines flights that were delayed at least 15 minutes, and p2, the proportion of Beta Airlines flights that were delayed at least 15 minutes. A random sample of 1,000 Alpha flights and a separate random sample of 1,000 Beta flights found that 67 of the Alpha fights and 160 of the Beta flights were delayed at least 15 minutes. The conditions for inference were checked and verified. Does this set of samples provide strong evidence that Alpha Airlines has a smaller proportion of flights that are delayed at least 15 minutes than Beta Airlines, at the α = 0.05 significance level? Find the z-table here. A. The test statistic is z = –6.56 and the P-value ≈ 0. Since the P-value ≈ 0 < 0.05, there is not sufficient evidence that Alpha Airlines has fewer delayed…arrow_forwardA researcher notes that there seems to be a difference in the prevalence of individuals who are medication adherent and have high levels of education along with a high health literacy and the prevalence of individuals who are not medication adherent and have low levels of education along with a low health literacy. Use the appropriate hypothesis to determine if education level and health literacy status are related (independent) at the 5%. Low Level of Education Low Medication Adherence High Medication Adherence Total Low Health Literacy 91 9 100 High Health Literacy 9 291 300 Total 100 300 400 High Level of Education Low Medication Adherence High Medication Adherence Total Low Health Literacy 96 4 100 High Health Literacy 4 296 300 Total 100 300 400arrow_forward
- Since its removal from the banned substances list in 2004 by the World Anti-Doping Agency,caffeine has been used by athletes with the expectancy that it enhances their workout andperformance. However, few studies look at the role caffeine plays in sedentary females.Researchers at the University of Western Australia conducted a test in which they determined therate of energy expenditure (kilojoules) on 10 healthy, sedentary females who were nonregularcaffeine users. Each female was randomly assigned either a placebo or caffeine pill (6mg/kg) 60minutes prior to exercise. The subject rode an exercise bike for 15 minutes at 65% of theirmaximum heart rate, and the energy expenditure was measured. The process was repeated on aseparate day for the remaining treatment. The mean difference in energy expenditure (caffeine –placebo) was 18kJ with a standard deviation of 19kJ. If we assume that the differences follow anormal distribution can it be concluded that that caffeine appears to increase…arrow_forwardReviewers from the Oregon Evidence-Based Practice Center at the Oregon Health and Science University investigated the effectiveness of prescription drugs in assisting people to fall asleep and stay asleep (source: S. Carson, M.S. McDonagh, et al., “Drug class review: Newer drugs for insomnia,” Oregon Health and Science University, 2008, http://www.ncbi.nlm.nih.gov). Suppose a study of two drugs, Sonata and Ambien, was conducted and the resulting data are contained in a file titled Shuteye. The samples reflect an experiment in which individuals were randomly given the two brands of pills on separate evenings. Their time spent sleeping was recorded for each of the brands of sleeping pills. (A) Does the experiment seem to have dependent or independent samples? Explain your reasoning. (B) Do the data indicate that there is a statistical difference in the mean time spent sleeping for people using the two drugs? Test using alpha = 0.02. Conduct a statistical procedure to determine this. (C)…arrow_forwardSuppose a researcher is interested inthe effectiveness in a new childhood exercise program implemented in a SRS of schools across a particular county. In order to test the hypothesis that the new program decreases BMI (Kg/m2), the researcher takes a SRS of children from schools where the program is employed and a SRS from schools that do not employ the program and compares the results. Assume the following table represents the SRSs of students and their BMIs. Student intervention group BMI (kg/m2) Student control group BMI (kg/m2) A 18.6 A 21.6 B 18.2 B 18.9 C 19.5 C 19.4 D 18.9 D 22.6 E 24.1 F 23.6 A) Assuming that all the necessary conditions are met (normality, independence, etc.) carry out the appropriate statistical test to determine if the new exercise program is effective. Use an alpha level of 0.05. Do not assume equal variances.B) Construct a 95% confidence interval about your estimate for the average difference in BMI between the groups.arrow_forward
- An article in the Journal of Quality Technology (Vol. 13, No. 2, 1981, pp. 111–114) describes an experimentthat investigates the effects of four bleaching chemicals on pulp brightness. These four chemicals wereselected at random from a large population of potential bleaching agents. The data are as follows:a. Test the significance of these chemical types with α=0.05.b. If proven significant, perform a multiple comparison method using Fisher’s LSDarrow_forwardDoes posting calorie content for menu items affectpeople’s choices in fast-food restaurants? According to results obtained by Elbel, Gyamfi, and Kersh(2011), the answer is no. The researchers monitoredthe calorie content of food purchases for children andadolescents in four large fast-food chains before andafter mandatory labeling began in New York City. Although most of the adolescents reported noticing thecalorie labels, apparently the labels had no effect ontheir choices. Data similar to the results obtained showan average of M = 786 calories per meal with s =85 for n =100 children and adolescents before thelabeling, compared to an average of M = 772 calorieswith s = 91 for a similar sample of n = 100 after themandatory posting.a. Use a two-tailed test with a = .05 to determinewhether the mean number of calories after theposting is significantly different than before caloriecontent was posted.b. Calculate r2to measure effect size for the mean difference.arrow_forwardA suburban hotel derives its revenue from its hotel and restaurant operations. Theowners are interested in the relationship between the number of rooms occupied on anightly basis and the revenue per day in the restaurant. Below is a sample of 25 days(Monday through Thursday) from last year showing the restaurant income and numberof rooms occupied.arrow_forward
 MATLAB: An Introduction with ApplicationsStatisticsISBN:9781119256830Author:Amos GilatPublisher:John Wiley & Sons Inc
 Probability and Statistics for Engineering and th...StatisticsISBN:9781305251809Author:Jay L. DevorePublisher:Cengage Learning
 Statistics for The Behavioral Sciences (MindTap C...StatisticsISBN:9781305504912Author:Frederick J Gravetter, Larry B. WallnauPublisher:Cengage Learning
 Elementary Statistics: Picturing the World (7th E...StatisticsISBN:9780134683416Author:Ron Larson, Betsy FarberPublisher:PEARSON
 The Basic Practice of StatisticsStatisticsISBN:9781319042578Author:David S. Moore, William I. Notz, Michael A. FlignerPublisher:W. H. Freeman
 Introduction to the Practice of StatisticsStatisticsISBN:9781319013387Author:David S. Moore, George P. McCabe, Bruce A. CraigPublisher:W. H. Freeman