
Mathematical Statistics with Applications
7th Edition
ISBN: 9780495110811
Author: Dennis Wackerly, William Mendenhall, Richard L. Scheaffer
Publisher: Cengage Learning
expand_more
expand_more
format_list_bulleted
Videos
Textbook Question
Chapter 13.2, Problem 1E
The reaction times for two different stimuli in a psychological word-association experiment were compared by using each stimulus on independent random samples of size 8. Thus, a total of 16 people were used in the experiment. Do the following data present sufficient evidence to indicate that there is a difference in the mean reaction times for the two stimuli?
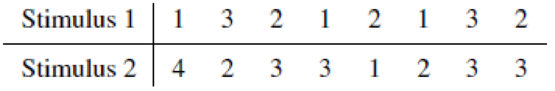
- a Use the ANOVA approach to test the appropriate hypotheses. Test at the α = .05 level of significance.
- b Applet Exercise Use the applet F-Ratio Probabilities and Quantiles to determine the exact p-value for the test in part (a).
- c Test the appropriate hypotheses by using the two-sample t test for comparing population means, which we developed in Section 10.8. Compare the value of the t statistic to the value of the F statistic calculated in part (a).
- d What assumptions are necessary for the tests implemented in the preceding parts?
Expert Solution & Answer
Want to see the full answer?
Check out a sample textbook solution
Students have asked these similar questions
A researcher was interested in the relationship between a swimmer’s hand length and corresponding time to complete the 100-meter freestyle. The researcher selected a random sample of twenty swimmers from all participants in a swim competition. Assuming all conditions for inference are met, which of the following significance tests should be used to investigate whether there is convincing evidence, at a 5 percent level of significance, that a longer hand length is associated with a decrease in the time to complete the 100-meter freestyle?
Independent random samples of 31 people living on the west side of a city and 25 people living on the east side of a city were taken to determine if the income levels of west side residents are greater than the income levels of east side residents. Given the testing statistics below, determine if the data provides sufficient evidence to conclude that the income levels of west side residents are greater than the income levels of east side residents, at the 2% significance level.
H0:μw≤μeHa:μw>μe
t0=0.511
t0.02=2.104
Select the correct answer below:
Yes; the test statistic is greater than the critical value.
No; the test statistic is greater than the critical value.
No; the test statistic is less than the critical value.
Yes; the test statistic is less than the critical value.
A researcher was interested in the relationship between a swimmer’s hand length and corresponding time to complete the 100-meter freestyle. The researcher selected a random sample of twenty swimmers from all participants in a swim competition. Assuming all conditions for inference are met, which of the following significance tests should be used to investigate whether there is convincing evidence, at a 5 percent level of significance, that a longer hand length is associated with a decrease in the time to complete the 100-meter freestyle?
A) matched-pairs t -test for a mean difference
B)A two-sample t -test for a difference between means
C)A two-sample z -test for a difference between proportions
D) A chi-square test of independence
E)A linear regression t-test for slope
Chapter 13 Solutions
Mathematical Statistics with Applications
Ch. 13.2 - The reaction times for two different stimuli in a...Ch. 13.2 - Prob. 2ECh. 13.4 - State the assumptions underlying the ANOVA of a...Ch. 13.4 - Prob. 4ECh. 13.4 - Prob. 5ECh. 13.4 - Suppose that independent samples of sizes n1, n2,,...Ch. 13.4 - Four chemical plants, producing the same products...Ch. 13.4 - Prob. 8ECh. 13.4 - Prob. 9ECh. 13.4 - A clinical psychologist wished to compare three...
Ch. 13.4 - It is believed that women in the postmenopausal...Ch. 13.4 - If vegetables intended for human consumption...Ch. 13.4 - One portion of the research described in a paper...Ch. 13.4 - The Florida Game and Fish Commission desires to...Ch. 13.4 - Prob. 15ECh. 13.4 - An experiment was conducted to examine the effect...Ch. 13.5 - Prob. 17ECh. 13.5 - Refer to Exercise 13.17 and consider YiYi for i ...Ch. 13.5 - Refer to the statistical model for the one-way...Ch. 13.7 - Refer to Examples 13.2 and 13.3. a Use the portion...Ch. 13.7 - Refer to Examples 13.2 and 13.4. a Use the portion...Ch. 13.7 - a Based on your answers to Exercises 13.20 and...Ch. 13.7 - Refer to Exercise 13.7. a Construct a 95%...Ch. 13.7 - Prob. 24ECh. 13.7 - Prob. 25ECh. 13.7 - Prob. 26ECh. 13.7 - Prob. 27ECh. 13.7 - Prob. 28ECh. 13.7 - Prob. 29ECh. 13.7 - Prob. 30ECh. 13.7 - Prob. 31ECh. 13.7 - Prob. 32ECh. 13.7 - Prob. 33ECh. 13.7 - Prob. 34ECh. 13.7 - Prob. 35ECh. 13.8 - Prob. 36ECh. 13.8 - Prob. 37ECh. 13.8 - Prob. 38ECh. 13.8 - Prob. 39ECh. 13.8 - Prob. 40ECh. 13.9 - Prob. 41ECh. 13.9 - The accompanying table presents data on yields...Ch. 13.9 - Refer to Exercise 13.42. Why was a randomized...Ch. 13.9 - Prob. 44ECh. 13.9 - Prob. 45ECh. 13.9 - Prob. 46ECh. 13.9 - Prob. 47ECh. 13.9 - Prob. 48ECh. 13.9 - Prob. 49ECh. 13.9 - Prob. 50ECh. 13.9 - Prob. 51ECh. 13.10 - Prob. 52ECh. 13.10 - Prob. 53ECh. 13.10 - Prob. 54ECh. 13.10 - Refer to Exercise 13.46. Construct a 95%...Ch. 13.10 - Prob. 56ECh. 13.10 - Prob. 57ECh. 13.11 - Prob. 58ECh. 13.11 - Prob. 59ECh. 13.11 - Prob. 60ECh. 13.11 - Prob. 61ECh. 13.11 - Prob. 62ECh. 13.12 - Prob. 63ECh. 13.12 - Prob. 64ECh. 13.12 - Prob. 65ECh. 13.12 - Prob. 66ECh. 13.12 - Prob. 67ECh. 13.12 - Prob. 68ECh. 13.13 - Prob. 69ECh. 13.13 - Prob. 70ECh. 13.13 - Refer to Exercise 13.42. Answer part (a) by...Ch. 13.13 - Refer to Exercise 13.45. Answer part (b) by...Ch. 13 - Prob. 73SECh. 13 - Prob. 74SECh. 13 - Prob. 75SECh. 13 - Prob. 77SECh. 13 - A study was initiated to investigate the effect of...Ch. 13 - Prob. 79SECh. 13 - A dealer has in stock three cars (models A, B, and...Ch. 13 - In the hope of attracting more riders, a city...Ch. 13 - Prob. 84SECh. 13 - Prob. 85SECh. 13 - Prob. 86SECh. 13 - Prob. 87SECh. 13 - Prob. 88SECh. 13 - Prob. 89SECh. 13 - Prob. 90SECh. 13 - Prob. 92SECh. 13 - Prob. 94SE
Knowledge Booster


Learn more about
Need a deep-dive on the concept behind this application? Look no further. Learn more about this topic, statistics and related others by exploring similar questions and additional content below.Similar questions
- What is meant by the sample space of an experiment?arrow_forwardA researcher was interested in the relationship between a swimmer’s hand length and corresponding time to complete the 100-meter freestyle. The researcher selected a random sample of twenty swimmers from all participants in a swim competition. Assuming all conditions for inference are met, which of the following significance tests should be used to investigate whether there is convincing evidence, at a 5 percent level of significance, that a longer hand length is associated with a decrease in the time to complete the 100-meter freestyle? A matched-pairs t-test for a mean difference A A two-sample t-test for a difference between means B A two-sample z-test for a difference between proportions C A chi-square test of independence D A linear regression tt-test for slope Earrow_forwardIn order to investigate a claim that the average time required for the county fire department to respond to a reported fire is greater than 15 minutes, county staff determined the response times for 40 randomly selected fire reports. The data was used to test H0H0: μ = 15 versus HaHa: μ > 15 and the computed P‐value was 0.12. If a 0.05 level of significance is used, what conclusions can be drawn? There is convincing evidence that the mean response time is 15 minutes (or less). There is convincing evidence that the mean response time is greater than 15 minutes. There is not convincing evidence that the mean response time is greater than 15 minutes.arrow_forward
- For a sample of 400 correctional officers at Lucasville State Prison, a researcher believes there is a relationship between “years on the job” and “willingness to help raise money for adult charities.” Using the following data, test the null hypothesis at the .01 level of significance that willingness to help raise donations does not differ by length of service as a correctional officer. In so doing, identify: (1) the research and null hypothesis, (2) the critical value needed to reject the null, (3) the decision that you made upon analyzing the data, and (4) the conclusion you have drawn based on the decision you have made.arrow_forwardIn a study of the effectiveness of a fabric device that acts like a support stocking for a weak or damaged heart, 110 people who consented to treatment were assigned at random to either a standard treatment consisting of drugs or the experimental treatment that consisted of drugs plus surgery to install the stocking. After two years, 30% of the 60 patients receiving the stocking had improved and 24% of the patients receiving the standard treatment had improved. (Use a statistical computer package to calculate the P-value. Use pexperimental − pstandard. Round your test statistic to two decimal places and your P-value to four decimal places.) z = ? P = ?arrow_forward
arrow_back_ios
arrow_forward_ios
Recommended textbooks for you
 College Algebra (MindTap Course List)AlgebraISBN:9781305652231Author:R. David Gustafson, Jeff HughesPublisher:Cengage Learning
College Algebra (MindTap Course List)
Algebra
ISBN:9781305652231
Author:R. David Gustafson, Jeff Hughes
Publisher:Cengage Learning
Hypothesis Testing using Confidence Interval Approach; Author: BUM2413 Applied Statistics UMP;https://www.youtube.com/watch?v=Hq1l3e9pLyY;License: Standard YouTube License, CC-BY
Hypothesis Testing - Difference of Two Means - Student's -Distribution & Normal Distribution; Author: The Organic Chemistry Tutor;https://www.youtube.com/watch?v=UcZwyzwWU7o;License: Standard Youtube License