
Concept explainers
Videos
The authors of the paper “Decreased Brain Volume in Adults with Childhood Lead Exposure” (Public Library of Science Medicine [May 27, 2008]: e112) studied the relationship between childhood environmental lead exposure and a measure of brain volume change in a particular region of the brain. Data were given for x = Mean childhood blood lead level (μg/dL) and y = Brain volume change (BVC, in percent). A subset of data read from a graph that appeared in the paper was used to produce the accompanying Minitab output.
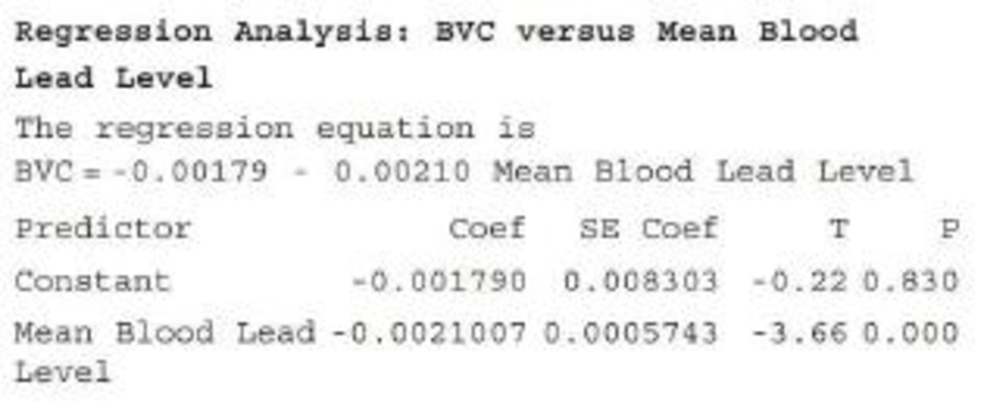
Carry out a hypothesis test to decide if there is convincing evidence of a useful linear relationship between x and y. Assume that the basic assumptions of the simple linear regression model are reasonably met.
Want to see the full answer?
Check out a sample textbook solution
Chapter 13 Solutions
Introduction To Statistics And Data Analysis


- A well-known multinational FMCG produces more than fifty products and sells them in themarket. Out of fifty products one is mineral water for drinking purpose and supplies differentsize pack bottles in the market. Product manager observed that, during hot days the sale of wateris more as compared to the normal days. He started the collection of data of weekly sale of waterand the average weekly temperature.Product manager was interested in developing a relationship between sales and temperature;therefore, he discussed and shared the following data with you. sales 7577696379807770738772738080698477727481 temperature 3236313134293235283130312935362832333233 Sale is in thousand liters and temperature is in degree Celsius. Data is Normally distributedYou are required to determine the following information for some concrete decision: a. Determine the statistical relationship between temperature and sale of water andinterpret.b. How much change in sales if the temperature…arrow_forwardIn a recent survey, ice cream truck drivers in Cincinnati, Ohio, reported that they make about $280 in income on a typical summer day. The income was generally higher on days with longer work hours, particularly hot days, and on holidays. The accompanying data file includes five weeks of the driver’s daily income (Income), number of hours on the road (Hours), whether it was a particularly hot day (Hot = 1 if the high temperature was above 85°F, 0 otherwise), and whether it was a Holiday (Holiday = 1, 0 otherwise). Income Hours Hot Holiday 196 5 1 0 282 8 0 0 318 6 1 0 232 5 1 0 276 8 0 0 312 8 0 1 193 5 0 1 110 4 0 0 321 8 1 0 283 8 0 0 325 8 1 0 247 7 0 1 398 8 1 1 448 8 1 1 214 4 0 0 235 8 0 0 238 8 0 0 148 3 1 0 313 8 0 1 449 8 1 1 332 8 1 1 247 8 0 0 363 7 1 0 393 7 1 1 254 8 0 0 228 8 0 0 355 6 1 1 248 7 0 1 291 8 1 0 255 5 1 0 239 6 0 0 181 6 0 0 222 7 0 0 170 5 0 1 374 6 1 1 1. Estimate the effect of…arrow_forwardThe director of an obesity clinic in a large northwestern city believes that drinking soft drinks contribute to obesity in children. To determine whether a relationship exists between these two variables, she conducts the following pilot study. Eight- 12-year-old male volunteers are randomly selected from children attending a local junior high school. Parents of the children are asked to monitor the number of soft drinks consumed by their child over a one week period. The children are weighed at the end of the week and their weights converted into body mass index (BMI) values. The BMI is a common index used to measure obesity and takes into account both height and weight. An individual is considered obese if they have a BMI value 30. The following data or collected: child. # of soft drinks consumed BMI 1 3 20 2 1 18 3…arrow_forward
- Assume we have data demonstrating a strong linear link between the amount of fertilizer applied to certain plants and their yield. Which is the independent variable in this research question?arrow_forwardA survey of 28 employed workers found that the correlation coefficient between the number of years of post-secondary education and current annual income in dollars is -0.38. The researchers hypothesize a positive relationship between number of years of post-secondary education and annual income. What can the researchers conclude with α = 0.05? a) Obtain/compute the appropriate values to make a decision about H0. critical value= test statistic= b) effect size= C) 1)There is a significant positive relationship between years of post-secondary education and current annual income. 2)There is a significant negative relationship between years of post-secondary education and current annual income. 3) There is no significant relationship between years of post-secondary education and current annual income.arrow_forwarda. Compute the incidence rate of coronary artery disease in patients receiving the new cholesterol medication. b. Compute the incidence rate of coronary artery disease in patients receiving a placebo. attached is the image of the data for this problemarrow_forward
- A fast-food chain decided to carry out an experiment to assess the influence of advertising expenditure on sales. Different relative changes in advertising expenditure, compared to the previous year, were made in eight regions of the country, and resulting changes in sales levels were observed the accompanying table shows the results. Increase in advertising expenditure (%) 0 5 15 20 25 30 35 40 Increase in sales (%) 5 10 18 25 35 50 60 65 Determine the value of ∑X, ∑X2, ∑Y, ∑Y2, ∑XY. Where X represent independent variable and Y for dependent variable. Determine and interpret the coefficient of correlation between the two variables. Determine the value of regressions coefficients and write down the simple linear regression model.…arrow_forwardA fast-food chain decided to carry out an experiment to assess the influence of advertising expenditure on sales. Different relative changes in advertising expenditure, compared to the previous year, were made in eight regions of the country, and resulting changes in sales levels were observed the accompanying table shows the results. Increase in advertising expenditure (%) 0 5 15 20 25 30 35 40 Increase in sales (%) 5 10 18 25 35 50 60 65 Determine the value of ∑X, ∑X2, ∑Y, ∑Y2, ∑XY. Where X represent independent variable and Y for dependent variable. Determine and interpret the coefficient of correlation between the two variables. Determine the value of regressions coefficients and write down the simple linear regression model. Test the validity of the model…arrow_forwardA study was done to determine the relationship between the alcohol content of beer, and the amount of calories in a 12 oz serving size. The sample data is provided in the data below. a) From this sample data, can you conclude (at the alpha=0.05 level) that there is in fact a linear correlation between the two variables? Use the statistics (correlation coefficient, value) to describe the correlation (if any). B) Using the sample data, find a regression equation to estimate the number of calories in a beer. C) Dogfish Head Brewery in Milton, Delaware has an I.P.A. beer called "120 minute IPA" which has an alcohol content of 18%. Using your regression equation, estimate the number of calories in a 12 oz serving of 120 Minute. Brand/Beer Alcohol Content (%) Calories (per 12 oz) Big Sky Scape Goat Pale Ale 4.70 163 Sierra Nevada Harvest Ale 6.70 215 Steel Reserve 8.10 222 Coors Light 4.15 104 Genesee Cream Ale 5.10 162 Sierra Nevada Summeefest Beer 5.00 158 Michelob Beer…arrow_forward
- In an attempt to develop a model of wine quality as judged by wine experts, data on alcohol content and wine quality was collected from variants of a particular wine. From a sample of 17 wines, a model was created using the percentages of alcohol to predict wine quality. From the results of that regression, b1=0.4386 and Sb1=0.1141. a. At the 0.05 level of significance, is there evidence of a linear relationship between the percentage of alcohol and wine quality? b. Construct a 95% confidence interval estimate of the population slope, β1. b. The 95% confidence interval is __ ≤ β1 ≤ __ (Round to three decimal places as needed.)arrow_forwardA deficiency of the trace element selenium in the diet can negatively impact growth, immunity, muscle and neuromuscular function, and fertility. The introduction of selenium supplements to dairy cows is justified when pastures have low selenium levels. Authors of the article “Effects of Short-Term Supplementation with Selenised Yeast on Milk Production and Composition of Lactating Cows” (Australian J. of Dairy Tech., 2004: 199–203) supplied the following data on milk selenium concentration (mg/L) for a sample of cows given a selenium supplement and a control sample given no supplement, both initially and after a 9-day period. Obs Init Se Init Cont Final Se Final Cont 1 11.4 9.1 138.3 9.3 2 9.6 8.7 104 8.8 3 10.1 9.7 96.4 8.8 4 8.5 10.8 89 10.1 5 10.3 10.9 88 9.6 6 10.6 10.6 103.8 8.6 7 11.8 10.1 147.3 10.4 8 9.8 12.3 97.1 12.4 9 10.9 8.8 172.6 9.3 10 10.3…arrow_forwardThe relationship between sleep hours and overall happiness level on the next day was estimated as below in a linear format. (Happiness level is measured through a five-point scale: 1 = Extremely unhappy, 5 = Extremely happy) Overall happiness level = 0.27 * Sleep hours + 2.34 (The p-value for the coefficient of Sleep hours is 0.02.) Based on this equation, what is the expected happiness level of a person on a certain day, when he slept 7 hours the day before?arrow_forward
 Glencoe Algebra 1, Student Edition, 9780079039897...AlgebraISBN:9780079039897Author:CarterPublisher:McGraw Hill