
Introduction To Statistics And Data Analysis
6th Edition
ISBN: 9781337793612
Author: PECK, Roxy.
Publisher: Cengage Learning,
expand_more
expand_more
format_list_bulleted
Concept explainers
Videos
Textbook Question
Chapter 13.2, Problem 28E
Consider the accompanying data on x = Research and development expenditure (thousands of dollars) and y = Growth rate (% per year) for eight different industries.
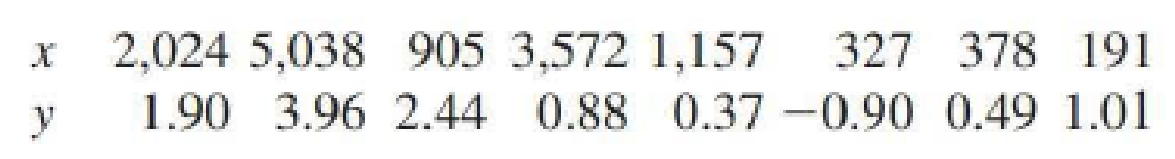
- a. Would a simple linear regression model provide useful information for predicting growth rate from research and development expenditure? Test the appropriate hypotheses using a 0.05 significance level.
- b. Use a 90% confidence
interval to estimate the average change in growth rate associated with a $1000 increase in expenditure. Interpret the resulting interval.
Expert Solution & Answer

Trending nowThis is a popular solution!

Students have asked these similar questions
A researcher developed a regression model to predict the cost of a meal based on the summated rating (sum of ratings for food, decor,and service) and the cost per meal for 12 restaurants. The results of the study show that
b1=1.4379 and Sb1=0.1397.
a. At the 0.05 level of significance, is there evidence of a linear relationship between the summated rating of a restaurant and the cost of a meal?
b. Construct a 95% confidence interval estimate of the population slope,
β1.
a. Determine the hypotheses for the test. Choose the correct answer below.
A.
H0:
β1=0
H1:
β1≠0
B.
H0:
β0≤0
H1:
β0>0
C.
H0:
β1≤0
H1:
β1>0
D.
H0:
β0≥0
H1:
β0<0
E.
H0:
β1≥0
H1:
β1<0
F.
H0:
β0=0
H1:
β0≠0
Compute the test statistic.
The test statistic is ?
(Round to two decimal places as needed.)
Determine the critical value(s).
The critical value(s) is(are) ?
(Use a comma to separate answers as needed.…
In exercise 12, the following data on x = average daily hotel room rate and y = amount spent on entertainment (The Wall Street Journal, August 18, 2011) lead to the estimated regression equation ŷ = 17.49 + 1.0334x. For these data SSE = 1541.4.Click on the datafile logo to reference the data. Use Table 1 of Appendix B.
a. Predict the amount spent on entertainment for a particular city that has a daily room rate of $89 (to 2 decimals).$
b. Develop a 95% confidence interval for the mean amount spent on entertainment for all cities that have a daily room rate of $89 (to 2 decimals).$ to $
c. The average room rate in Chicago is $128. Develop a 95% prediction interval for the amount spent on entertainment in Chicago (to 2 decimals).
In exercise 12, the following data on x = average daily hotel room rate and y = amount spent on entertainment (The Wall Street Journal, August 18, 2011) lead to the estimated regression equation ŷ = 17.49 + 1.0334x. For these data SSE = 1541.4. Use Table 1 of Appendix B.Click on the datafile logo to reference the data.
a. Predict the amount spent on entertainment for a particular city that has a daily room rate of $89 (to 2 decimals).$
b. Develop a 95% confidence interval for the mean amount spent on entertainment for all cities that have a daily room rate of $89 (to 2 decimals).$ to $
c. The average room rate in Chicago is $128. Develop a 95% prediction interval for the amount spent on entertainment in Chicago (to 2 decimals).$ to $
Chapter 13 Solutions
Introduction To Statistics And Data Analysis
Ch. 13.1 - Let x be the size of a house (in square feet) and...Ch. 13.1 - Consider the variables and population regression...Ch. 13.1 - The flow rate in a device used for air quality...Ch. 13.1 - The paper Predicting Yolk Height, Yolk Width,...Ch. 13.1 - A sample of small cars was selected, and the...Ch. 13.1 - Prob. 6ECh. 13.1 - Suppose that a simple linear regression model is...Ch. 13.1 - a. Explain the difference between the line y x...Ch. 13.1 - Prob. 9ECh. 13.1 - Hormone replacement therapy (HRT) is thought to...
Ch. 13.1 - Consider the data and estimated regression line...Ch. 13.1 - A simple linear regression model was used to...Ch. 13.1 - Consider the accompanying data on x = Advertising...Ch. 13.2 - What is the difference between and b? What is the...Ch. 13.2 - The largest commercial fishing enterprise in the...Ch. 13.2 - Prob. 16ECh. 13.2 - Prob. 17ECh. 13.2 - Prob. 18ECh. 13.2 - An experiment to study the relationship between x...Ch. 13.2 - The paper The Effects of Split Keyboard Geometry...Ch. 13.2 - The authors of the paper Decreased Brain Volume in...Ch. 13.2 - Do taller adults make more money? The authors of...Ch. 13.2 - Researchers studying pleasant touch sensations...Ch. 13.2 - Prob. 24ECh. 13.2 - Acrylamide is a chemical that is sometimes found...Ch. 13.2 - Prob. 26ECh. 13.2 - Exercise 13.18 described a regression analysis...Ch. 13.2 - Consider the accompanying data on x = Research and...Ch. 13.2 - Prob. 29ECh. 13.2 - In anthropological studies, an important...Ch. 13.3 - The graphs accompanying this exercise are based on...Ch. 13.3 - Prob. 32ECh. 13.3 - Prob. 33ECh. 13.3 - The article Vital Dimensions in Volume Perception:...Ch. 13.3 - Prob. 35ECh. 13.3 - An investigation of the relationship between x =...Ch. 13.4 - Prob. 37ECh. 13.4 - Prob. 38ECh. 13.4 - In Exercise 13.19, we considered a regression of y...Ch. 13.4 - Prob. 40ECh. 13.4 - A subset of data read from a graph that appeared...Ch. 13.4 - Prob. 42ECh. 13.4 - Prob. 43ECh. 13.4 - The article first introduced in Exercise 13.34 of...Ch. 13.4 - The shelf life of packaged food depends on many...Ch. 13.4 - For the cereal data of the previous exercise, the...Ch. 13.4 - The article Performance Test Conducted for a Gas...Ch. 13.5 - Prob. 48ECh. 13.5 - Prob. 49ECh. 13.5 - A sample of n = 353 college faculty members was...Ch. 13.5 - Prob. 51ECh. 13.5 - Prob. 52ECh. 13.5 - The accompanying summary quantities for x =...Ch. 13.5 - Prob. 54ECh. 13.5 - Prob. 55ECh. 13.6 - Prob. 56ECh. 13 - Prob. 1CRECh. 13 - Prob. 2CRECh. 13 - Prob. 3CRECh. 13 - Prob. 4CRECh. 13 - Prob. 5CRECh. 13 - The accompanying graphical display is similar to...Ch. 13 - Prob. 7CRECh. 13 - Prob. 8CRECh. 13 - Consider the following data on y = Number of songs...Ch. 13 - Many people take ginkgo supplements advertised to...Ch. 13 - Prob. 11CRECh. 13 - Prob. 12CRECh. 13 - Prob. 13CRECh. 13 - Prob. 14CRECh. 13 - The discharge of industrial wastewater into rivers...Ch. 13 - Many people take ginkgo supplements advertised to...Ch. 13 - It is hypothesized that when homing pigeons are...Ch. 13 - Prob. 18CRECh. 13 - Prob. 57CRCh. 13 - Prob. 58CRCh. 13 - Prob. 59CRCh. 13 - The article Photocharge Effects in Dye Sensitized...Ch. 13 - Prob. 61CRCh. 13 - Prob. 62CRCh. 13 - Prob. 63CRCh. 13 - Prob. 64CRCh. 13 - Prob. 65CRCh. 13 - The article Improving Fermentation Productivity...Ch. 13 - Prob. 67CRCh. 13 - Prob. 68CRCh. 13 - Prob. 69CR
Knowledge Booster


Learn more about
Need a deep-dive on the concept behind this application? Look no further. Learn more about this topic, statistics and related others by exploring similar questions and additional content below.Similar questions
- Mr. James, president of Daniel-James Financial Services, believes that there is a relationship between the number of client contacts and the dollar amount of sales. To document this assertion, he gathered the following information from a sample of clients for the last month. Let X represent the number of times that the client was contacted and Y represent the valye of sales ($1000) for each client sampled. Number of Contacts (X) Sales ($1000) 14 24 12 14 20 28 16 30 23 30 a) Compute the regression equation for client contacts and sales. Interpret the slope and intercept parameters.arrow_forwardIf there is no significant correlation between the response and explanatory variables, would the slope of the regression line be (a) positive (b) negative (c) zero?arrow_forwardIn Exercises, assume that the variables under consideration satisfy the assumptions for regression inferences. Based on a sample of data points, what is the best estimate of the population regression line?arrow_forward
- Bill is the office manager for a group of financial advisors who provide financial services for individual clients. She would like to investigate whether a relationship exists between the number of presentations made to prospective clients in a month and the number of new clients per month. The following table shows the number of presentations and corresponding new clients for a random sample of six employees. Employee Presentations New Clients 1 2 1 2 8 2 3 9 4 4 10 3 5 11 5 6 12 6 Bill would like to use simple regression analysis to estimate the number of new clients per month based on the number of presentations made by the employee per month. The average number of new clients per month for an employee who made 20 presentations per month is ________. 5.02 5.45 3.43 8.69arrow_forwardThe following table lists the monthly incomes (in hundreds of dollars) and the monthly rents paid (in hundreds of dollars) by a sample of six families. Monthly Income Monthly Rent 24 7.0 16 4.5 19 6.5 31 11.6 10 4.5 27 8.5 1.The 99% confidence interval for the slope, B, of the population regression line is (2 decimals): __________________________________________ 2. The null hypothesis is that the slope of the population regression line of monthly rent on monthly income is zero and the alternative hypothesis is that the slope of this population regression line is greater than zero. The significance level is 1%. What is the critical value of t (3 decimals)? __________________________________________ 3. The null hypothesis is that the slope of the population regression line of monthly rent on monthly income is zero and the alternative hypothesis is that the slope of this population regression line is greater than zero. The significance level is 1%. What is…arrow_forwardThe following data are the monthly salaries and the grade point averages for students who obtained a bachelor's degree in business administration. GPA Monthly Salary ($) 2.6 3,600 3.4 3,900 3.6 4,300 3.2 3,800 3.5 4,200 2.9 3,900 The estimated regression equation for these data is and . Use Table 1 of Appendix B. a. Develop a point estimate of the starting salary for a student with a GPA of (to 1 decimal). b. Develop a confidence interval for the mean starting salary for all students with a GPA (to 2 decimals). ( , ) c. Develop a prediction interval for Ryan Dailey, a student with a GPA of (to 2 decimals). ( , ) d. Discuss the differences in your answers to parts (b) and (c).arrow_forward
- consider the coefficient estimates of the following market model linear regression of general motors (gm) on the S&P500 market returns coefficient estimate std error tvalue pr(>ItI) intercept 0.005860 0.0003704 1.582 0.12412 sp500 0.0904753 0.266702 3.392 0.00196 The number of observations is 32.At the 1% significance level, what is the (1)test statistic value,(2) the critical values (3) decision regarding the null hypothesis that the beta coefficient on the market returns is equal to 1.61arrow_forwardA random sample of 15 college soccer players were selected to investigate the relationship between heart rate and maximal oxygen uptake. The heart rate and maximal oxygen uptake were recorded for each player during a training session. A regression analysis of the data was conducted, where heart rate is the explanatory variable and maximal oxygen uptake is the response variable. If a 95 percent confidence interval is constructed for the slope of the population regression line, which of the following is a condition that must be checked? A)The true relationship between heart rate and maximal oxygen uptake is linear. B)The correlation between heart rate and maximal oxygen uptake is not equal to zero. C)The confidence interval is not biased. D).The point (x_,y_) falls on the regression line. The X and Y have a line on top. E)The slope is not equal to zero.arrow_forwardSarah is the office manager for a group of financial advisors who provide financial services for individual clients. She would like to investigate whether a relationship exists between the number of presentations made to prospective clients in a month and the number of new clients per month. The following table shows the number of presentations and corresponding new clients for a random sample of six employees. Employee Presentations New Clients 1 7 2 2 9 3 3 9 4 4 10 3 5 11 5 6 12 3 Sarah would like to use simple regression analysis to estimate the number of new clients per month based on the number of presentations made by the employee per month. The expected number of new clients per month for an employee who made 10 presentations per month is ________. 2.3982 1.6753 3.0521 3.4348arrow_forward
- In order to determine a realistic price for a new product that a company wants to market the company’s research department selected 10 sites thought to have essentially identical sales potential and offered the product in each at a different price. The resulting sales are recorded in the accompanying table: Price ($) Sales ($1,000s) 15.00 15 15.50 14 16.00 16 16.50 9 17.00 12 17.50 10 18.00 8 18.50 9 19.00 6 19.50 5 c). Find the equation of the sample regression line using Minitab. d). Interpret the meaning of the coefficients of the equation of the sample regression line.arrow_forwardIn order to answer the question, "If total rainfall turns out to be 12.7 inches next growing season, how many bushels of corn per acre can I expect to harvest?", what kind of statistical analysis would you perform? a. test of hypothesis b. calculate a confidence interval c. perform a linear regression d. calculate a correlation coefficientarrow_forwardDoes the sugar cane model suffer from heteroscedasticity? Perform a Breusch-Pegan test as well as a Whitetest to verify what the residual plots suggests, based on the following regression results:arrow_forward
arrow_back_ios
SEE MORE QUESTIONS
arrow_forward_ios
Recommended textbooks for you
 Glencoe Algebra 1, Student Edition, 9780079039897...AlgebraISBN:9780079039897Author:CarterPublisher:McGraw Hill
Glencoe Algebra 1, Student Edition, 9780079039897...
Algebra
ISBN:9780079039897
Author:Carter
Publisher:McGraw Hill
Correlation Vs Regression: Difference Between them with definition & Comparison Chart; Author: Key Differences;https://www.youtube.com/watch?v=Ou2QGSJVd0U;License: Standard YouTube License, CC-BY
Correlation and Regression: Concepts with Illustrative examples; Author: LEARN & APPLY : Lean and Six Sigma;https://www.youtube.com/watch?v=xTpHD5WLuoA;License: Standard YouTube License, CC-BY