
Concept explainers
Videos
a.
To construct:a
a.
Answer to Problem 7E
Explanation of Solution
Given information: the sample size
Formula Used:the formulas to be used when constructing a confidence interval for a mean response and when constructing a prediction interval for an individual response.
Let
Here, the critical value
Let
Here, the critical value
the predicted value corresponding to
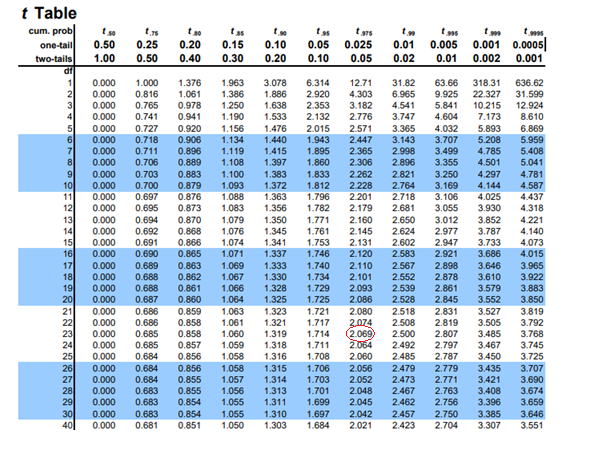
The t table corresponding t-value for the given confidence interval

Now to construct prediction interval for the mean response.
b.
To construct: a
b.
Answer to Problem 7E
Explanation of Solution
Given information: the sample size
Formula Used:the formulas to be used when constructing a confidence interval for a mean response and when constructing a prediction interval for an individual response.
Let
Here, the critical value
Let
Here, the critical value
the predicted value corresponding to
The t table corresponding t-value for the given confidence interval
Now to construct prediction interval for the individual response.
Want to see more full solutions like this?
Chapter 13 Solutions
Elementary Statistics ( 3rd International Edition ) Isbn:9781260092561


 Glencoe Algebra 1, Student Edition, 9780079039897...AlgebraISBN:9780079039897Author:CarterPublisher:McGraw Hill