
Introduction To Statistics And Data Analysis
6th Edition
ISBN: 9781337793612
Author: PECK, Roxy.
Publisher: Cengage Learning,
expand_more
expand_more
format_list_bulleted
Concept explainers
Videos
Textbook Question
Chapter 13.3, Problem 34E
The article “Vital Dimensions in Volume Perception: Can the Eye Fool the Stomach?” (Journal of Marketing Research [1999]: 313–326) gave the accompanying data on the dimensions of 27 representative food products (Gerber baby food, Cheez Whiz, Skippy Peanut Butter, and Ahmed’s tandoori paste, to name a few).
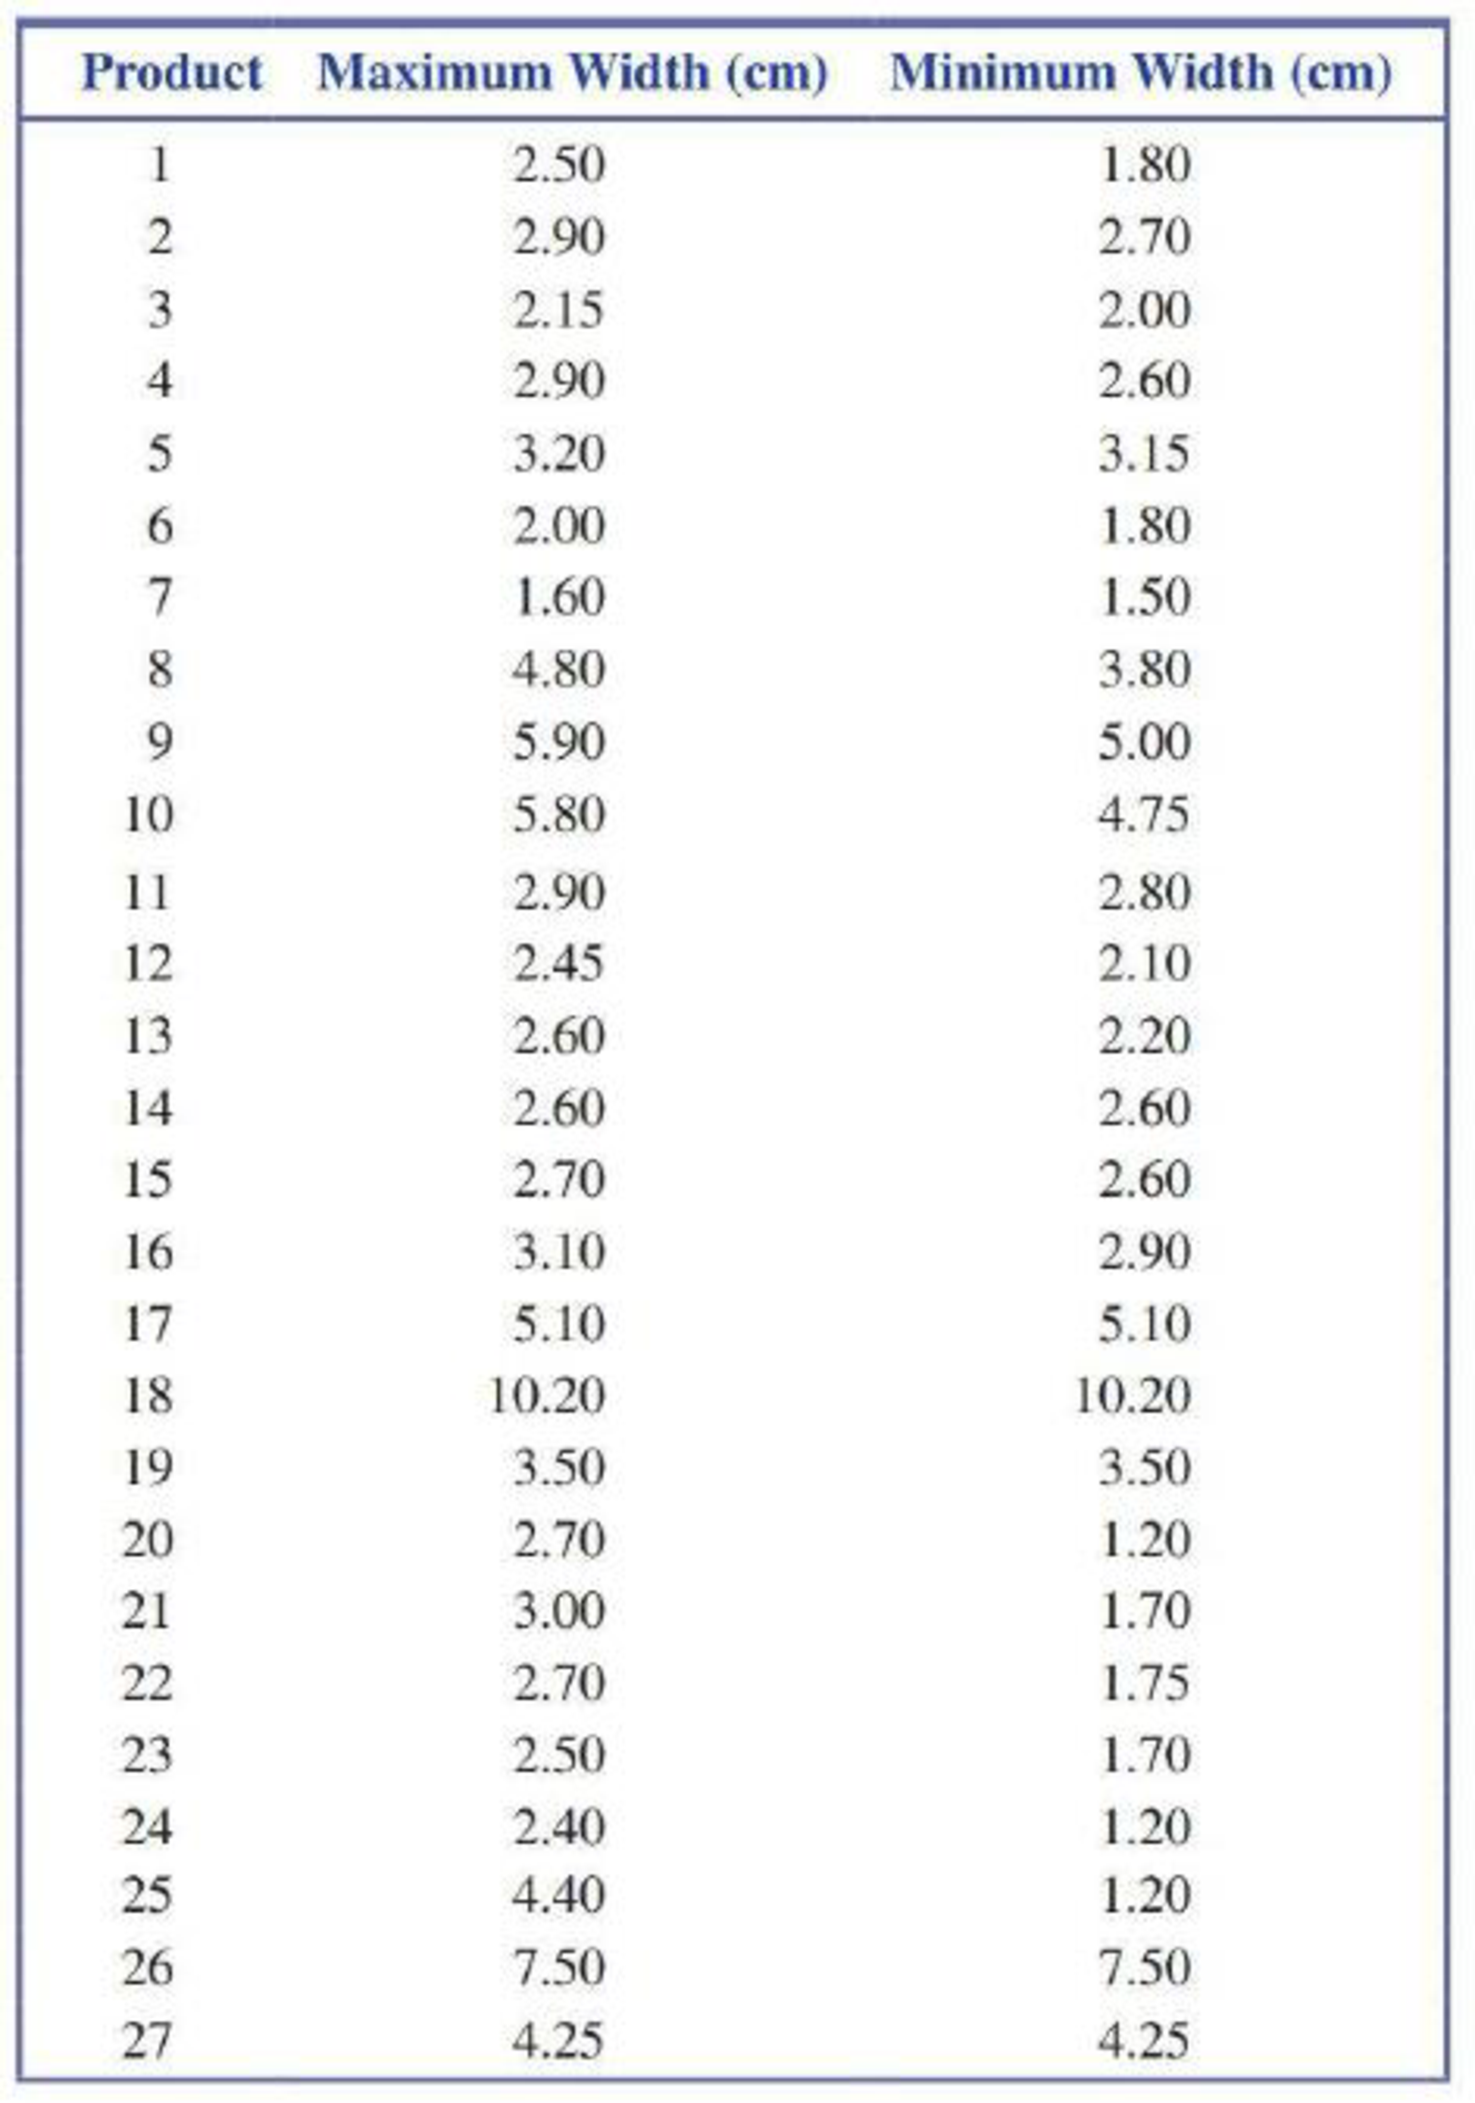
- a. Fit the simple linear regression model that would allow prediction of the maximum width of a food container based on its minimum width.
- b. Calculate the standardized residuals (or just the residuals if a computer program that doesn’t give standardized residuals is used) and make a residual plot to determine whether there are any outliers.
- c. The data point with the largest residual is for a 1-liter Coke bottle. Delete this data point and determine the equation of the regression line. Did deletion of this point result in a large change in the equation of the estimated regression line?
- d. For the regression line of Part (c), interpret the estimated slope and, if appropriate, the intercept.
- e. For the data set with the Coke bottle deleted, are the assumptions of the simple linear regression model reasonable? Give statistical evidence.
Expert Solution & Answer

Trending nowThis is a popular solution!

Students have asked these similar questions
A researcher notes that, in a certain region, a disproportionate number of software millionaires were born around the year 1955. Is this a coincidence, or does birth year matter when gauging whether a software founder will besuccessful? The researcher investigated this question by analyzing the data shown in the accompanying table. Complete parts a through c below.
a. Find the coefficient of determination for the simple linear regression model relating number (y) of software millionaire birthdays in a decade to total number (x) of births in the region. Interpret the result.
The coefficient of determination is 1.___?
(Round to three decimal places as needed.)
This value indicates that 2.____ of the sample variation in the number of software millionaire birthdays is explained by the
linear relationship with the total number of births in the region.
(Round to one decimal place as needed.)
b. Find the coefficient of determination for the simple linear regression model…
A sixth-grade teacher believes that there is a relationship between his students’ IQscores (y) and the numbers of hours (x) they spend watching television each week. Thefollowing table shows a random sample of 7 sixth-grade students.y 125 116 97 114 85 107 105x 5 10 30 16 41 28 21
Does the data provide sufficient evidence to indicate that the simple linear regressionmodel is appropriate to describe the relationship between x and y? Perform a model utilitytest at α = 0.05. (Give H0, Ha, rejection region, observed test statistic, P-value, decisionand conclusion.)Find the Pearson sample correlation coefficient between x and y. Then interpretthe result.
The following information pertains to a simple least squares regression for DEF Corporation:
Mean value of the dependent variable 30Mean value of the independent variable 8Coefficient of the independent variable 3Number of observations 12
What is the "a" value for the leasts-quares regression model?
a. 60b. 30c. 6d. 0
Chapter 13 Solutions
Introduction To Statistics And Data Analysis
Ch. 13.1 - Let x be the size of a house (in square feet) and...Ch. 13.1 - Consider the variables and population regression...Ch. 13.1 - The flow rate in a device used for air quality...Ch. 13.1 - The paper Predicting Yolk Height, Yolk Width,...Ch. 13.1 - A sample of small cars was selected, and the...Ch. 13.1 - Prob. 6ECh. 13.1 - Suppose that a simple linear regression model is...Ch. 13.1 - a. Explain the difference between the line y x...Ch. 13.1 - Prob. 9ECh. 13.1 - Hormone replacement therapy (HRT) is thought to...
Ch. 13.1 - Consider the data and estimated regression line...Ch. 13.1 - A simple linear regression model was used to...Ch. 13.1 - Consider the accompanying data on x = Advertising...Ch. 13.2 - What is the difference between and b? What is the...Ch. 13.2 - The largest commercial fishing enterprise in the...Ch. 13.2 - Prob. 16ECh. 13.2 - Prob. 17ECh. 13.2 - Prob. 18ECh. 13.2 - An experiment to study the relationship between x...Ch. 13.2 - The paper The Effects of Split Keyboard Geometry...Ch. 13.2 - The authors of the paper Decreased Brain Volume in...Ch. 13.2 - Do taller adults make more money? The authors of...Ch. 13.2 - Researchers studying pleasant touch sensations...Ch. 13.2 - Prob. 24ECh. 13.2 - Acrylamide is a chemical that is sometimes found...Ch. 13.2 - Prob. 26ECh. 13.2 - Exercise 13.18 described a regression analysis...Ch. 13.2 - Consider the accompanying data on x = Research and...Ch. 13.2 - Prob. 29ECh. 13.2 - In anthropological studies, an important...Ch. 13.3 - The graphs accompanying this exercise are based on...Ch. 13.3 - Prob. 32ECh. 13.3 - Prob. 33ECh. 13.3 - The article Vital Dimensions in Volume Perception:...Ch. 13.3 - Prob. 35ECh. 13.3 - An investigation of the relationship between x =...Ch. 13.4 - Prob. 37ECh. 13.4 - Prob. 38ECh. 13.4 - In Exercise 13.19, we considered a regression of y...Ch. 13.4 - Prob. 40ECh. 13.4 - A subset of data read from a graph that appeared...Ch. 13.4 - Prob. 42ECh. 13.4 - Prob. 43ECh. 13.4 - The article first introduced in Exercise 13.34 of...Ch. 13.4 - The shelf life of packaged food depends on many...Ch. 13.4 - For the cereal data of the previous exercise, the...Ch. 13.4 - The article Performance Test Conducted for a Gas...Ch. 13.5 - Prob. 48ECh. 13.5 - Prob. 49ECh. 13.5 - A sample of n = 353 college faculty members was...Ch. 13.5 - Prob. 51ECh. 13.5 - Prob. 52ECh. 13.5 - The accompanying summary quantities for x =...Ch. 13.5 - Prob. 54ECh. 13.5 - Prob. 55ECh. 13.6 - Prob. 56ECh. 13 - Prob. 1CRECh. 13 - Prob. 2CRECh. 13 - Prob. 3CRECh. 13 - Prob. 4CRECh. 13 - Prob. 5CRECh. 13 - The accompanying graphical display is similar to...Ch. 13 - Prob. 7CRECh. 13 - Prob. 8CRECh. 13 - Consider the following data on y = Number of songs...Ch. 13 - Many people take ginkgo supplements advertised to...Ch. 13 - Prob. 11CRECh. 13 - Prob. 12CRECh. 13 - Prob. 13CRECh. 13 - Prob. 14CRECh. 13 - The discharge of industrial wastewater into rivers...Ch. 13 - Many people take ginkgo supplements advertised to...Ch. 13 - It is hypothesized that when homing pigeons are...Ch. 13 - Prob. 18CRECh. 13 - Prob. 57CRCh. 13 - Prob. 58CRCh. 13 - Prob. 59CRCh. 13 - The article Photocharge Effects in Dye Sensitized...Ch. 13 - Prob. 61CRCh. 13 - Prob. 62CRCh. 13 - Prob. 63CRCh. 13 - Prob. 64CRCh. 13 - Prob. 65CRCh. 13 - The article Improving Fermentation Productivity...Ch. 13 - Prob. 67CRCh. 13 - Prob. 68CRCh. 13 - Prob. 69CR
Knowledge Booster


Learn more about
Need a deep-dive on the concept behind this application? Look no further. Learn more about this topic, statistics and related others by exploring similar questions and additional content below.Similar questions
- The basal metabolic rate (kcal/day) of large anteaters is believed to be subject to a power law relationship with its weight (kg). A study was performed measuring several anteaters and reported the following data: Weight (kg) 6.0 28.5 16.0 19.0 23.5 11.0 9.0 25.5 22.0 BMR (kcal/day) 80.1 247.0 162.3 172.4 215.1 111.9 104.6 224.6 208.3 Transform the data correctly to perform a linear least-squares regression, then report your model as y=cxpy=cxp. Estimate the BMR for a 27 kg anteater.arrow_forwardA U.S. state's Bureau of Economic Geology published a study on the economic impact of using carbon dioxide enhanced oil recovery (EOR) technology to extract additional oil from fields that have reached the end of their conventional economic life. The following table gives the approximate number of jobs for the citizens that would be created at various levels of recovery. Percent Recovery (%) 20 40 80 100 Jobs Created (Millions) 6 9 12 18 Find the regression line. j(r) = Use the regression line to estimate the number of jobs that would be created at a recovery level of 60%. _____ million jobsarrow_forwardThe following data is representative of that reported in an article on nitrogen emissions, with x = burner area liberation rate (MBtu/hr-ft2) and y = NOx emission rate (ppm): x 100 125 125 150 150 200 200 250 250 300 300 350 400 400 y 160 140 190 210 200 320 280 400 440 430 400 600 600 660 (a) Assuming that the simple linear regression model is valid, obtain the least squares estimate of the true regression line. (Round all numerical values to four decimal places.)y = (b) What is the estimate of expected NOx emission rate when burner area liberation rate equals 240? (Round your answer to two decimal places.)ppm(c) Estimate the amount by which you expect NOx emission rate to change when burner area liberation rate is decreased by 60. (Round your answer to two decimal places.)ppm(d) Would you use the estimated regression line to predict emission rate for a liberation rate of 500? Why or why not? Yes, the data is perfectly linear, thus lending to accurate predictions.…arrow_forward
- An auto manufacturing company wanted to investigate how the price of one of its car models depreciates with age. The research department at the company took a sample of eight cars of this model and collected the following information on the ages (in years) and prices (in hundreds of dollars) of these cars. Age 8 8 5 2 6 5 2 2 Price 38 19 53 70 40 51 80 80 1.) Find the least squares regression line equation in the form ^ = a+bx. y Use "Age" as the independent variable and "Price" as the dependent variable. 2.) Predict the price of a 5 year old car of this model. ypred=arrow_forwardAn online market evaluation company e-Serve collects data and provides analytic solutions for sales promotion. A subsample of e-Serve for promotion expenditure and sales of several ecommerce businesses in million taka are provided below.Promotion 22 15 4 4 7 10 12 15 17 15Sales 150 100 80 100 90 120 110 120 130 140(a) Show that a simple linear regression model can be fitted with these variables and state a linear model for these variables. How the least square method is used to estimate parameters in a linear regression model?(b) At 5% level of significance test the hypothesis that the correlation is not positive. Based on the test result comment on the sign of the regression coefficient.(c) Find the regression line of sales on promotion expenditure by estimating parameters. Also, test the significance of slope coefficient at 5% level.(d) Find the 95% confidence interval for the mean sales with promotion expenditure of 7 million taka and comment on your results.arrow_forwardThe Update to the Task Force Report on Blood Pressure Control in Children [12] reported the observed 90th per-centile of SBP in single years of age from age 1 to 17 based on prior studies. The data for boys of average height are given in Table 11.18. Suppose we seek a more efficient way to display the data and choose linear regression to accomplish this task. age sbp 1 99 2 102 3 105 4 107 5 108 6 110 7 111 8 112 9 114 10 115 11 117 12 120 13 122 14 125 15 127 16 130 17 132 Do you think the linear regression provides a good fit to the data? Why or why not? Use residual analysis to justify your answer. Am I supposed to run a residual plot and QQ-plot for this question?arrow_forward
- The following data is representative of that reported in an article on nitrogen emissions, with x = burner area liberation rate (MBtu/hr-ft2) and y = NOx emission rate (ppm): x 100 125 125 150 150 200 200 250 250 300 300 350 400 400 y 140 150 180 210 190 310 270 410 440 450 380 600 600 670 (a) Assuming that the simple linear regression model is valid, obtain the least squares estimate of the true regression line. (Round all numerical values to four decimal places.)y = (b) What is the estimate of expected NOx emission rate when burner area liberation rate equals 200? (Round your answer to two decimal places.) ppm(c) Estimate the amount by which you expect NOx emission rate to change when burner area liberation rate is decreased by 60. (Round your answer to two decimal places.) ppm(d) Would you use the estimated regression line to predict emission rate for a liberation rate of 500? Why or why not? Yes, the data is perfectly linear, thus lending to accurate…arrow_forwardSuppose a study wants to predict the market price of a certain species of turtle (Y) based on the following independent variables indicated in the table. Based from the table, what is the equation of the multiple linear regression? (Round off up to two decimal places. Market Price = 0.07 - 0.40*weight + 1.51*length + 1.41*width + 0.80*age Market Price = - 0.40*weight + 1.51*length + 1.41*width + 0.80*age Market Price = 0.07 + 0.40*weight + 1.51*length + 1.41*width + 0.80*age Market Price = 0.07 - 0.40 + weight + 1.51 + length + 1.41 + width + 0.80 + agearrow_forwardSnowpacks contain a wide spectrum of pollutants thatmay represent environmental hazards. The article“Atmospheric PAH Deposition: Deposition Velocitiesand Washout Ratios” (J. of EnvironmentalEngineering, 2002: 186–195) focused on the depositionof polyaromatic hydrocarbons. The authors proposeda multiple regression model for relating depositionover a specified time period (y, in mg/m2) to tworather complicated predictors x1 (mg-sec/m3) and x2 (mg/m2), defined in terms of PAH air concentrations forvarious species, total time, and total amount of precipitation.Here is data on the species fluoranthene andcorresponding Minitab output:obs x1 x2 flth1 92017 .0026900 278.782 51830 .0030000 124.533 17236 .0000196 22.654 15776 .0000360 28.685 33462 .0004960 32.666 243500 .0038900 604.707 67793 .0011200 27.698 23471 .0006400 14.189 13948 .0004850 20.6410 8824 .0003660 20.6011 7699 .0002290 16.6112 15791 .0014100 15.0813 10239 .0004100 18.0514 43835 .0000960 99.7115 49793 .0000896 58.9716 40656…arrow_forward
- The data regarding the production of wheat in tons (X) and the price of the kilo of flour in Ghana cedis (Y) Takoradi some years ago were: a. Fit the regression line for the day using the method of least squaresarrow_forwardIn a certain type of metal test specimen, the normal stress on a specimen is known tobe functionally related to the shear resistance. The following is a set of codedexperimental data on the two variables:Normal stress (X) 26.8 25.4 28.9 23.6 27.7 23.9 24.7Shear resistance (Y) 26.5 27.3 24.2 27.1 23.6 25.9 26.3i) Estimate the linear regression line and interpret regressioncoefficient.ii) Comment about of goodness of fit of the estimated regression line.arrow_forwardAn econometrician suspects that the residuals of her model might be autocorrelated. Explain the steps involved in testing this theory using the Durbin–Watson (DW) testarrow_forward
arrow_back_ios
SEE MORE QUESTIONS
arrow_forward_ios
Recommended textbooks for you
 Linear Algebra: A Modern IntroductionAlgebraISBN:9781285463247Author:David PoolePublisher:Cengage Learning
Linear Algebra: A Modern Introduction
Algebra
ISBN:9781285463247
Author:David Poole
Publisher:Cengage Learning
Correlation Vs Regression: Difference Between them with definition & Comparison Chart; Author: Key Differences;https://www.youtube.com/watch?v=Ou2QGSJVd0U;License: Standard YouTube License, CC-BY
Correlation and Regression: Concepts with Illustrative examples; Author: LEARN & APPLY : Lean and Six Sigma;https://www.youtube.com/watch?v=xTpHD5WLuoA;License: Standard YouTube License, CC-BY