
Concept explainers
Videos
Online Auctions The following graph shows the rate of change
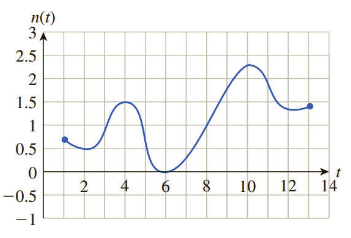
Use a left Riemann sum with four subdivisions to estimate the total change in the number of active users from the second quarter of 2008 to the second quarter of 2010 (the interval
). [HINT: See Example 3.]
Want to see the full answer?
Check out a sample textbook solution
Chapter 13 Solutions
Finite Mathematics and Applied Calculus (MindTap Course List)


 Algebra & Trigonometry with Analytic GeometryAlgebraISBN:9781133382119Author:SwokowskiPublisher:Cengage