
Videos
One portion of the research described in a paper by Yean-Jye Lu5 involved an evaluation of maneuver times for vehicles of various sizes that were involved in making a left turn at an intersection with a separate left-turn lane but without a separate left-turn phase on the traffic light governing the intersection (an “unprotected” left-turn maneuver). The maneuver time was measured from the instant that a vehicle entered the opposing lanes of traffic until it completely cleared the intersection. Four-cylinder automobiles were classified as “small cars” and sixor eight-cylinder automobiles as “large cars.” Trucks and buses were combined to form a third category identified as “truck or bus.” Other motorized vehicles (motorcycles, etc.) were ignored in the study. A summary of the data, giving maneuver times (in seconds) for vehicles that attempted the left-turn maneuver from a standing stop, appears in the accompanying table.
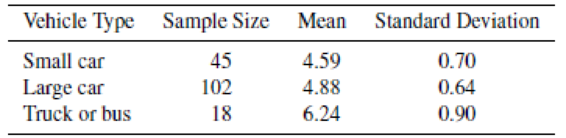
a Is there sufficient evidence to claim that the mean maneuver times differ for the three vehicle types? Give bounds for the attained significance level.
b Indicate the appropriate conclusion for an α = .05 level test.
Want to see the full answer?
Check out a sample textbook solution
Chapter 13 Solutions
Mathematical Statistics with Applications


- The authors of a paper investigated whether water temperature was related to how far a salamander would swim and whether it would swim upstream or downstream. Data for 14 streams with different mean water temperatures where salamander larvae were released are given (approximated from a graph that appeared in the paper). The two variables of interest are x = mean water temperature (°C) and y = net directionality, which was defined as the difference in the relative frequency of the released salamander larvae moving upstream and the relative frequency of released salamander larvae moving downstream. A positive value of net directionality means a higher proportion were moving upstream than downstream. A negative value of net directionality means a higher proportion were moving downstream than upstream. Mean Temperature (x) Net Directionality (y) 6.12 −0.088.11 0.25 8.57 −0.1410.51 0.00 12.5 0.08 12.04 0.03 12.45 −0.0717.93 0.29 18.34 0.23 19.84 0.24 20.3 0.19 19.02 0.14 17.78 0.05 19.67…arrow_forwardA research study was conducted at a local college collecting data on the models (brands) of cars parked in the student parking lot. This type of data collected would be considered/described as Qualitative Data or Quantitative Data?arrow_forwardA study is conducted to determine the relationship between study hours and exam scores, what is the dependent variable in this scenario?arrow_forward
- Fish produce a hormone called isotocin, a hormone that is similar to oxytocin in mammals. Both hormones, oxytocin and isotocin, have been linked to social behaviors including the suppression of social anxiety, trust, and attachment. Prior to this study the relationship between isotocin in the bloodstream and the amount of aggression or submission individual cichlid fish display was unknown. The researchers hypothesized that isotocin would suppress aggressive behaviors in cichlids to promote social cohesion as these fish exist in large social groups (schools). To address this hypothesis each of 10 fish were exposed to two treatments 1 week apart. One at a time a fish was randomly selected from the group of 10 and either injected with a saline solution ( that served as the control) or with isotocin. After this injection the fish was returned to its group and the amount of aggressive and submissive behaviors the fish demonstrated was recorded for the next 10 minutes. One week later this…arrow_forwardFish produce a hormone called isotocin, a hormone that is similar to oxytocin in mammals. Both hormones, oxytocin and isotocin, have been linked to social behaviors including the suppression of social anxiety, trust, and attachment. Prior to this study the relationship between isotocin in the bloodstream and the amount of aggression or submission individual cichlid fish display was unknown. The researchers hypothesized that isotocin would suppress aggressive behaviors in cichlids to promote social cohesion as these fish exist in large social groups (schools). To address this hypothesis each of 10 fish were exposed to two treatments 1 week apart. One at a time a fish was randomly selected from the group of 10 and either injected with a saline solution ( that served as the control) or with isotocin. After this injection the fish was returned to its group and the amount of aggressive and submissive behaviors the fish demonstrated was recorded for the next 10 minutes. One week later this…arrow_forwardRead the following excerpt of an article published on psychologytoday.com: “Researchers found that about 40% of college students in their study binge drink (i.e., consuming 5 or more drinks in a short amount of time) and that the vast majority of campus sexual assaults are fueled by alcohol.” Identify the variables of interest and indicate which the independent is and which the dependent variable is. Identify the classification of the independent variable (discrete or continuous) and explain the reason for your choice. Discuss what measure of central tendency is the most appropriate for each variable (independent and dependent variable) making sure to explain why.arrow_forward
- A manufacturing company would like to assess the effectiveness of the advertisement campaign that is currently using in order to increase the sales of its products. The campaign includes both printed form of advertisements and advertisements through the radio. During a trial period of about one month they collected data for 22 consecutive weeks. The company spent different amounts for advertising in those weeks using at least one of the two kinds of advertisements. The sales (denoted by sales) are measured in thousands of dollars and so are the amounts spent for printed forms of advertisements (denoted by print_ad) and through the radio (denoted by radio_ad). Some of the results of the analysis are given below. Intercept radio_ad print_ad Standard Coefficients Error t Stat 156.4304345 126.7578563 1.234089 P-value 0.232217 13.08068096 1.759373685 7.434851 4.89E-07 16.79527808 2.963377915 5.667613 1.83E-05 Which of the following is TRUE Επιλέξτε ένα: O a. if the variable radio_ad is…arrow_forwardHow many variables are included in the scatterplot in Figure 2.84(a)? Identify each as categorical or quantitative. Estimate the range for Variable1 and for Variable2. Considering Direction of Association (a) How many variables are included in the scatterplot in Figure 2.84(a)? Identify each as categorical or quantitative. Estimate the range for Variable1 and for Variable2. Figure 2.84 Describe the association between these variables (b) In Figure 2.84(a), does the association between the variables appear to be positive or negative? (c) Figure 2.84(b) shows the same scatterplot with regression line added. Which variable is the response variable? Does the line show a positive or negative association?arrow_forwardAs the world warms, the geographic ranges of species might shift toward cooler areas. Chen et al. (2011) studied recent changes in the highest elevation at which species occur. Typically, higher elevations are cooler than lower elevations. Below are the changes in highest elevation for 20 of the 31 taxa examined in this study, in meters, over the late 1900s and early 2000s. (Taxa included plants, vertebrates, and arthropods.) Positive numbers indicate upward shifts in elevation, and negative numbers indicate shifts to lower elevations. The values are also displayed in the attached graph. What is the standard error of the mean of elevational range shift in these 20 species? (Do not include units, but remember they are meters), and express answer to 3 significant digits) 58.9 7.8 108.6 44.8 19.2 30.5 7.4 39.3 24 62.1 24.3 32.7 65.3 -19.3 -5.2 -2.1 31 88.6 20.7 89 9 8 7 6 5 4 3 2 1 0 Elevation change in m [-19.3, 0.7] (0.7, 20.7] (20.7, 40.7] (40.7, 60.7] (60.7, 80.7] (80.7, 100.7 100.7,…arrow_forward
- A college bookstore must order books two months before each semester starts. They believe that the number of books that will ultimately be sold for any particular course is related to the number of students registered for the course when the books are ordered. They would like to develop a bestfitting line to predict how many books to order. From past records, the bookstore obtains the number of students registered, X, and the number of books actually sold for a course, Y , for 12 different semesters.A scatterplot of the data along with the best fitting line is presented below. a. The correlation between the two variables is r = .89. Calculate and interpret the value of r2.b. The equation for the best fitting line is Y = 9.30 + 0.673X. Explain and interpret the value of 9.30.c. How many books should the store order for a class of 50 students? Would you trust this prediction?arrow_forwardSince muscle tension in the head region has been associated with tension headaches, a researcher reasoned that if the muscle tension could be changed, perhaps the headaches would also be changed. The researcher designed an experiment in which nine subjects with tension headaches participated. The subjects kept daily logs of the number of headaches they experienced during a 2-week baseline period. Then the researcher trained them to change their muscle tension in the head region, using a biofeedback device. For this experiment, the biofeedback device was connected to a muscle in the forehead region. The device indicated the subject's amount of tension in the muscle to which it was attached and helped them achieve low tension levels. After 6 weeks of training, during which the subjects became successful at maintaining low muscle tension, they again kept a 2-week log of the number of headaches experienced. The following are the number of headaches recorded during each 2-week period.…arrow_forwardThe main post office in Tampa, Florida, is due to be replaced with a much larger, more modern facility that can handle the tremendous flow of mail that has followed the city's growth since 1970. Since all mail, incoming or outgoing, travels from the seven regional post offices in Tampa through the main post office, its site selection can mean a big difference in overall delivery and movement efficiency. Using the data in the following table, help Postmaster Purushottam Meena calculate the center of gravity location for the proposed new facility. Regional Post office Map Coordinates (x, y) Ybor City Davis Island Dale-Mabry Palma Cela Bayshore Temple Terrace Hyde Park (11,6) (17,18) (15,6) (7,11) (2,11) (4,18) (3,12) The center of gravity is: x-coordinate= (round your response to two decimal places). y-coordinate= (round your response to two decimal places). D₂ Truck Round Trips per Day 11 11 10 14 13 11 18arrow_forward
 Glencoe Algebra 1, Student Edition, 9780079039897...AlgebraISBN:9780079039897Author:CarterPublisher:McGraw Hill
 Big Ideas Math A Bridge To Success Algebra 1: Stu...AlgebraISBN:9781680331141Author:HOUGHTON MIFFLIN HARCOURTPublisher:Houghton Mifflin Harcourt