
Introduction To Statistics And Data Analysis
6th Edition
ISBN: 9781337793612
Author: PECK, Roxy.
Publisher: Cengage Learning,
expand_more
expand_more
format_list_bulleted
Concept explainers
Videos
Textbook Question
Chapter 13.4, Problem 41E
A subset of data read from a graph that appeared in the paper “Decreased Brain Volume in Adults with Childhood Lead Exposure” (Public Library of Science Medicine [May 27, 2008]: e112) was used to produce the following Minitab output, where x = Mean childhood blood lead level (μg/dL) and y = Brain volume change (percentage). (See Exercise 13.21 for a more complete description of the study described in this paper.)
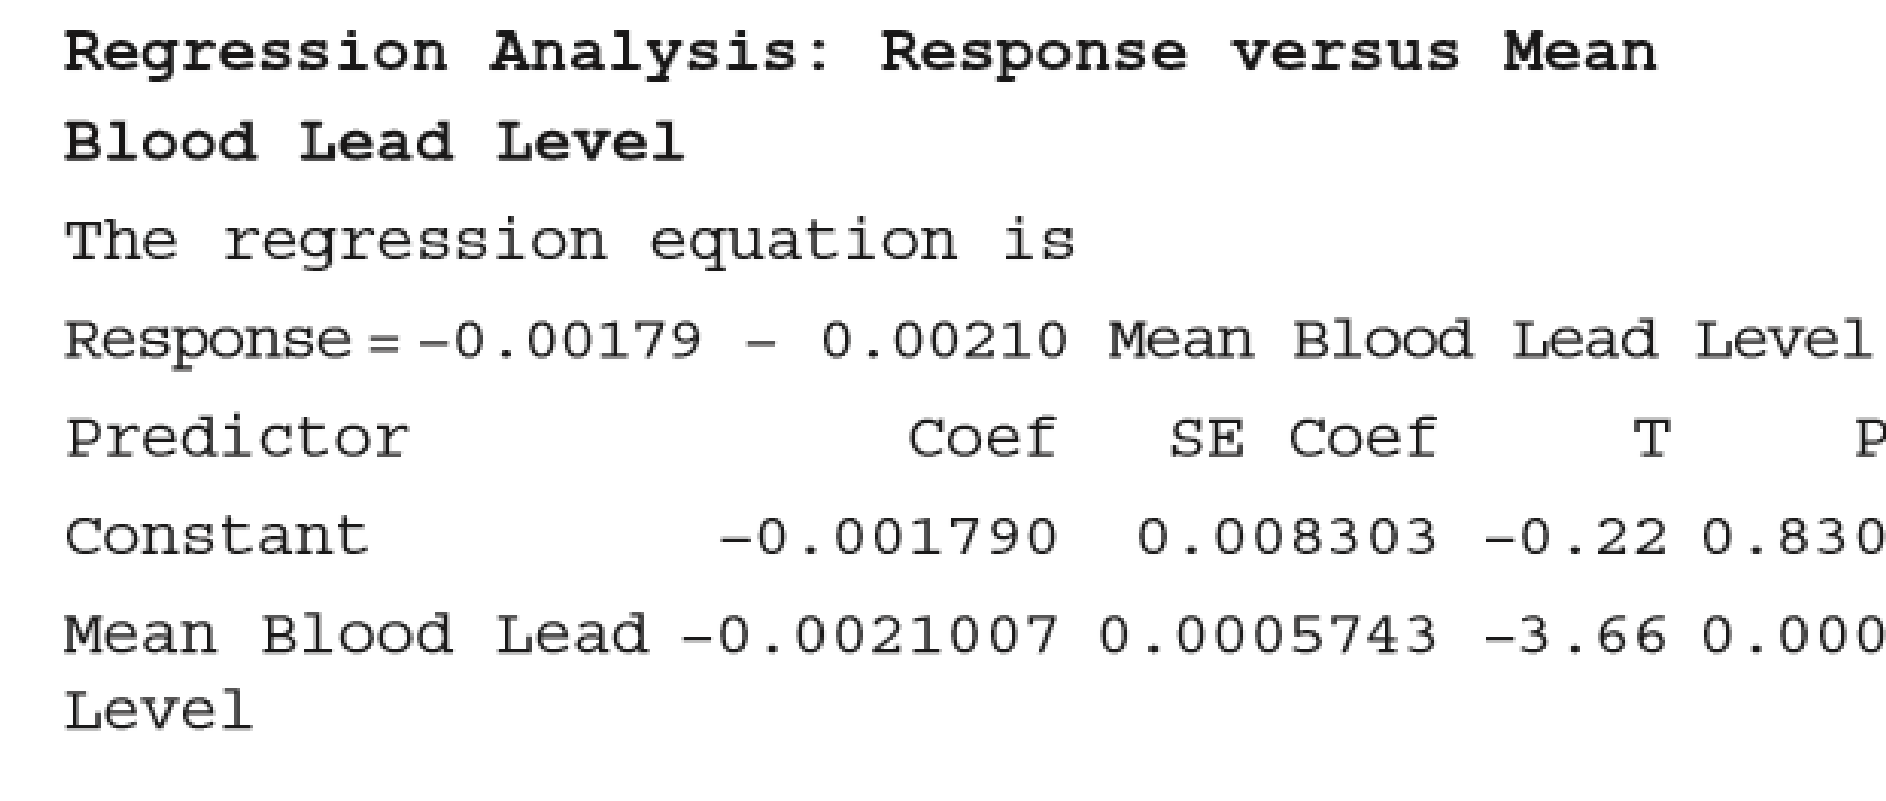
- a. What is the equation of the estimated regression line?
- b. For this data set,
- c. Construct a 90% prediction interval for brain volume change for a person with a childhood blood lead level of 20 μg/dL.
- d. Explain the difference in interpretation of the intervals computed in Parts (b) and (c).
Expert Solution & Answer
Want to see the full answer?
Check out a sample textbook solution
Students have asked these similar questions
Compute the forecasted values for Yt for July and August in 2020 by using the modelsstated in (c) and (d)
The following data was collected to analyze whether temperature correlates with bacterial growth. Five recombinant strains of E. coli that each grows optimally at different temperatures were grown for 6 hours and their concentration was measured. Plot a xy scatter graph with a line of best fit to determine whether there is a correlation between temperature and growth rate
A researcher hypothesizes that in a certain country the net annual growth of private sector purchases of government bonds, B, is positively related to the nominal rate of interest on the bonds, NI, and negatively related to the rate of inflation Π:
Bt = a0 + a1NIt + a2Π t + ut
Note that it may be hypothesized that B depends on the real rate of interest on bonds, R, where R = NI – Π.
Using a sample of 56 annual observations, s/he estimates the following equations:
(1) Bt = 0.43 + 0.90NIt - 0.97Πt R21 = 0.962, SSR1 = 2.20, QRESET(F1,52) = 16.6
(3.58) (8.80) (-1.05)
(2) Bt = 0.44 + 0.94Rt R22 = 0.960, SSR2 = 2.22, QRESET(F1,53) = 0.9
(9.70) (16.7)
(3) Bt = 0.44 + 1.14NIt SSR3 = 9.20, QRESET(F1,53) = 59.9
(8.84) (36.1)
(4) NIt = 0.08 + 0.94Πt R24 = 0.997, SSR4 = 0.18, QRESET(F1,53) = 1.4…
Chapter 13 Solutions
Introduction To Statistics And Data Analysis
Ch. 13.1 - Let x be the size of a house (in square feet) and...Ch. 13.1 - Consider the variables and population regression...Ch. 13.1 - The flow rate in a device used for air quality...Ch. 13.1 - The paper Predicting Yolk Height, Yolk Width,...Ch. 13.1 - A sample of small cars was selected, and the...Ch. 13.1 - Prob. 6ECh. 13.1 - Suppose that a simple linear regression model is...Ch. 13.1 - a. Explain the difference between the line y x...Ch. 13.1 - Prob. 9ECh. 13.1 - Hormone replacement therapy (HRT) is thought to...
Ch. 13.1 - Consider the data and estimated regression line...Ch. 13.1 - A simple linear regression model was used to...Ch. 13.1 - Consider the accompanying data on x = Advertising...Ch. 13.2 - What is the difference between and b? What is the...Ch. 13.2 - The largest commercial fishing enterprise in the...Ch. 13.2 - Prob. 16ECh. 13.2 - Prob. 17ECh. 13.2 - Prob. 18ECh. 13.2 - An experiment to study the relationship between x...Ch. 13.2 - The paper The Effects of Split Keyboard Geometry...Ch. 13.2 - The authors of the paper Decreased Brain Volume in...Ch. 13.2 - Do taller adults make more money? The authors of...Ch. 13.2 - Researchers studying pleasant touch sensations...Ch. 13.2 - Prob. 24ECh. 13.2 - Acrylamide is a chemical that is sometimes found...Ch. 13.2 - Prob. 26ECh. 13.2 - Exercise 13.18 described a regression analysis...Ch. 13.2 - Consider the accompanying data on x = Research and...Ch. 13.2 - Prob. 29ECh. 13.2 - In anthropological studies, an important...Ch. 13.3 - The graphs accompanying this exercise are based on...Ch. 13.3 - Prob. 32ECh. 13.3 - Prob. 33ECh. 13.3 - The article Vital Dimensions in Volume Perception:...Ch. 13.3 - Prob. 35ECh. 13.3 - An investigation of the relationship between x =...Ch. 13.4 - Prob. 37ECh. 13.4 - Prob. 38ECh. 13.4 - In Exercise 13.19, we considered a regression of y...Ch. 13.4 - Prob. 40ECh. 13.4 - A subset of data read from a graph that appeared...Ch. 13.4 - Prob. 42ECh. 13.4 - Prob. 43ECh. 13.4 - The article first introduced in Exercise 13.34 of...Ch. 13.4 - The shelf life of packaged food depends on many...Ch. 13.4 - For the cereal data of the previous exercise, the...Ch. 13.4 - The article Performance Test Conducted for a Gas...Ch. 13.5 - Prob. 48ECh. 13.5 - Prob. 49ECh. 13.5 - A sample of n = 353 college faculty members was...Ch. 13.5 - Prob. 51ECh. 13.5 - Prob. 52ECh. 13.5 - The accompanying summary quantities for x =...Ch. 13.5 - Prob. 54ECh. 13.5 - Prob. 55ECh. 13.6 - Prob. 56ECh. 13 - Prob. 1CRECh. 13 - Prob. 2CRECh. 13 - Prob. 3CRECh. 13 - Prob. 4CRECh. 13 - Prob. 5CRECh. 13 - The accompanying graphical display is similar to...Ch. 13 - Prob. 7CRECh. 13 - Prob. 8CRECh. 13 - Consider the following data on y = Number of songs...Ch. 13 - Many people take ginkgo supplements advertised to...Ch. 13 - Prob. 11CRECh. 13 - Prob. 12CRECh. 13 - Prob. 13CRECh. 13 - Prob. 14CRECh. 13 - The discharge of industrial wastewater into rivers...Ch. 13 - Many people take ginkgo supplements advertised to...Ch. 13 - It is hypothesized that when homing pigeons are...Ch. 13 - Prob. 18CRECh. 13 - Prob. 57CRCh. 13 - Prob. 58CRCh. 13 - Prob. 59CRCh. 13 - The article Photocharge Effects in Dye Sensitized...Ch. 13 - Prob. 61CRCh. 13 - Prob. 62CRCh. 13 - Prob. 63CRCh. 13 - Prob. 64CRCh. 13 - Prob. 65CRCh. 13 - The article Improving Fermentation Productivity...Ch. 13 - Prob. 67CRCh. 13 - Prob. 68CRCh. 13 - Prob. 69CR
Knowledge Booster


Learn more about
Need a deep-dive on the concept behind this application? Look no further. Learn more about this topic, statistics and related others by exploring similar questions and additional content below.Similar questions
- In a recent survey, ice cream truck drivers in Cincinnati, Ohio, reported that they make about $280 in income on a typical summer day. The income was generally higher on days with longer work hours, particularly hot days, and on holidays. The accompanying data file includes five weeks of the driver’s daily income (Income), number of hours on the road (Hours), whether it was a particularly hot day (Hot = 1 if the high temperature was above 85°F, 0 otherwise), and whether it was a Holiday (Holiday = 1, 0 otherwise). Income Hours Hot Holiday 196 5 1 0 282 8 0 0 318 6 1 0 232 5 1 0 276 8 0 0 312 8 0 1 193 5 0 1 110 4 0 0 321 8 1 0 283 8 0 0 325 8 1 0 247 7 0 1 398 8 1 1 448 8 1 1 214 4 0 0 235 8 0 0 238 8 0 0 148 3 1 0 313 8 0 1 449 8 1 1 332 8 1 1 247 8 0 0 363 7 1 0 393 7 1 1 254 8 0 0 228 8 0 0 355 6 1 1 248 7 0 1 291 8 1 0 255 5 1 0 239 6 0 0 181 6 0 0 222 7 0 0 170 5 0 1 374 6 1 1 1. Estimate the effect of…arrow_forwardThe weights (in pounds) of 66 vehicles and the variability of their braking distances (in feet) when stopping on a dry surface are shown in the table. Can you conclude that there is a significant linear correlation between vehicle weight and variability in braking distance on a dry surface? Use alphaαequals=0.010.01. Weight, x 59205920 53205320 65006500 51005100 58405840 48004800 Variability in braking distance, y 1.761.76 1.921.92 1.911.91 1.591.59 1.691.69 1.501.50 find the critical valuearrow_forwardDyslexia refers to a specific reading disability that affects 10% to 15% of the general population. A dyslexic child is defined as a child of normal or above-normal intelligence with no known organic behavioural disorders who, despite normal schooling, shows a reading lag of at least two years. A researcher proposed that dyslexia was the result of a complex visual deficit that could be immediately corrected by simply putting a blue plastic overlay on the reading material. To test this, 100 dyslexic children were randomly assigned to one of two groups, one of which read from pages with a clear plastic overlay and the other of which read from pages with a blue plastic overlay. The dependent variable was percentage correct on a multiple-choice reading comprehension test. a) Is this an observational study or an experiment? Explain your choice. b) Why did the researcher use a clear overlay as one of the treatment groups instead of just having the children read the passage without an…arrow_forward
- Dyslexia refers to a specific reading disability that affects 10% to 15% of the general population. A dyslexic child is defined as a child of normal or above-normal intelligence with no known organic behavioural disorders who, despite normal schooling, shows a reading lag of at least two years. A researcher proposed that dyslexia was the result of a complex visual deficit that could be immediately corrected by simply putting a blue plastic overlay on the reading material. To test this, 100 dyslexic children were randomly assigned to one of two groups, one of which read from pages with a clear plastic overlay and the other of which read from pages with a blue plastic overlay. The dependent variable was percentage correct on a multiple-choice reading comprehension test. What assumptions for the hypothesis test would need to be conducted for a one sample t test? Which data on spss would i need to look at for the assumptions?arrow_forwardAt the 5% level of significance, which variables are statistically significant? If the price of cement per yard increases by 10, what will happen to the estimated quantity of cement demanded? What happens if it will increase by 20%?arrow_forwardA deficiency of the trace element selenium in the diet can negatively impact growth, immunity, muscle and neuromuscular function, and fertility. The introduction of selenium supplements to dairy cows is justified when pastures have low selenium levels. Authors of the article “Effects of Short-Term Supplementation with Selenised Yeast on Milk Production and Composition of Lactating Cows” (Australian J. of Dairy Tech., 2004: 199–203) supplied the following data on milk selenium concentration (mg/L) for a sample of cows given a selenium supplement and a control sample given no supplement, both initially and after a 9-day period. Obs Init Se Init Cont Final Se Final Cont 1 11.4 9.1 138.3 9.3 2 9.6 8.7 104 8.8 3 10.1 9.7 96.4 8.8 4 8.5 10.8 89 10.1 5 10.3 10.9 88 9.6 6 10.6 10.6 103.8 8.6 7 11.8 10.1 147.3 10.4 8 9.8 12.3 97.1 12.4 9 10.9 8.8 172.6 9.3 10 10.3…arrow_forward
- By what percentage is salary predicted to increase if ros increases by 50 points? Does ros have a practically large effect on salary?arrow_forwardListed below are the overhead widths (in cm) of seals measured from photographs and the weights (in kg) of the seals. Construct a scatterplot, find the value of the linear correlation coefficient r, and find the critical values of r using alpha equals 0.05. Is there sufficient evidence to conclude that there is a linear correlation between overhead widths of seals from photographs and the weights of theseals? Overhead Width 7.1 7.6 9.7 9.3 8.6 8.2 Weight 115 197 243 198 197 186arrow_forwardResearchers interested in lead exposure due to car exhaust sampled the blood of 52 police officers subjected to constant inhalation of automobile exhaust fumes while working traffic enforcement in a primarily urban environment. The blood samples of these officers had an average lead concentration of 124.32 µg/l and a SD of 37.74 µg/l; a previous study of individuals from a nearby suburb, with no history of exposure, found an average blood level concentration of 35 µg/l. Based on your preceding result, without performing a calculation, would a 99% confidence interval for the average blood concentration level of police officers contain 35 µg/l? Based on your preceding result, without performing a calculation, would a 99% confidence interval for this difference contain 0? Explain why or why not.arrow_forward
- A well-known multinational FMCG produces more than fifty products and sells them in themarket. Out of fifty products one is mineral water for drinking purpose and supplies differentsize pack bottles in the market. Product manager observed that, during hot days the sale of wateris more as compared to the normal days. He started the collection of data of weekly sale of waterand the average weekly temperature.Product manager was interested in developing a relationship between sales and temperature;therefore, he discussed and shared the following data with you. sales 7577696379807770738772738080698477727481 temperature 3236313134293235283130312935362832333233 Sale is in thousand liters and temperature is in degree Celsius. Data is Normally distributedYou are required to determine the following information for some concrete decision: a. Determine the statistical relationship between temperature and sale of water andinterpret.b. How much change in sales if the temperature…arrow_forwardIf a newborn lab rat receives a hormone and its weight (in ounces) is converted into a z score that is greater than +2.00, what would the researcher most likely conclude about whether or not the hormone had an effect on the rat's weight?arrow_forwardThe article “Withdrawal Strength of Threaded Nails” (D. Rammer, S. Winistorfer, and D. Bender, Journal of Structural Engineering 2001:442–449) describes an experiment comparing the ultimate withdrawal strengths (in N/mm) for several types of nails. For an annularly threaded nail with shank diameter 3.76 mm driven into spruce-pine-fir lumber, the ultimate withdrawal strength was modeled as lognormal with μ = 3.82 and σ = 0.219. For a helically threaded nail under the same conditions, the strength was modeled as lognormal with μ = 3.47 and σ = 0.272. a) What is the mean withdrawal strength for annularly threaded nails? b) What is the mean withdrawal strength for helically threaded nails? c) For which type of nail is it more probable that the withdrawal strength will be greater than 50 N/mm? d) What is the probability that a helically threaded nail will have a greater withdrawal strength than the median for annularly threaded nails? e) An experiment is performed in which withdrawal…arrow_forward
arrow_back_ios
SEE MORE QUESTIONS
arrow_forward_ios
Recommended textbooks for you
 Glencoe Algebra 1, Student Edition, 9780079039897...AlgebraISBN:9780079039897Author:CarterPublisher:McGraw Hill
Glencoe Algebra 1, Student Edition, 9780079039897...
Algebra
ISBN:9780079039897
Author:Carter
Publisher:McGraw Hill
Correlation Vs Regression: Difference Between them with definition & Comparison Chart; Author: Key Differences;https://www.youtube.com/watch?v=Ou2QGSJVd0U;License: Standard YouTube License, CC-BY
Correlation and Regression: Concepts with Illustrative examples; Author: LEARN & APPLY : Lean and Six Sigma;https://www.youtube.com/watch?v=xTpHD5WLuoA;License: Standard YouTube License, CC-BY