
Concept explainers
Videos
The shelf life of packaged food depends on many factors. Dry cereal is considered to be a moisture-sensitive product (no one likes soggy cereal!) with the shelf life determined primarily by moisture content. In a study of the shelf life of one particular brand of cereal, x = Time on shelf (days stored at 73°F and 50% relative humidity) and y = Moisture content (%) were recorded. The resulting data are from “Computer Simulation Speeds Shelf Life Assessments” (Package Engineering [1983]: 72–73).
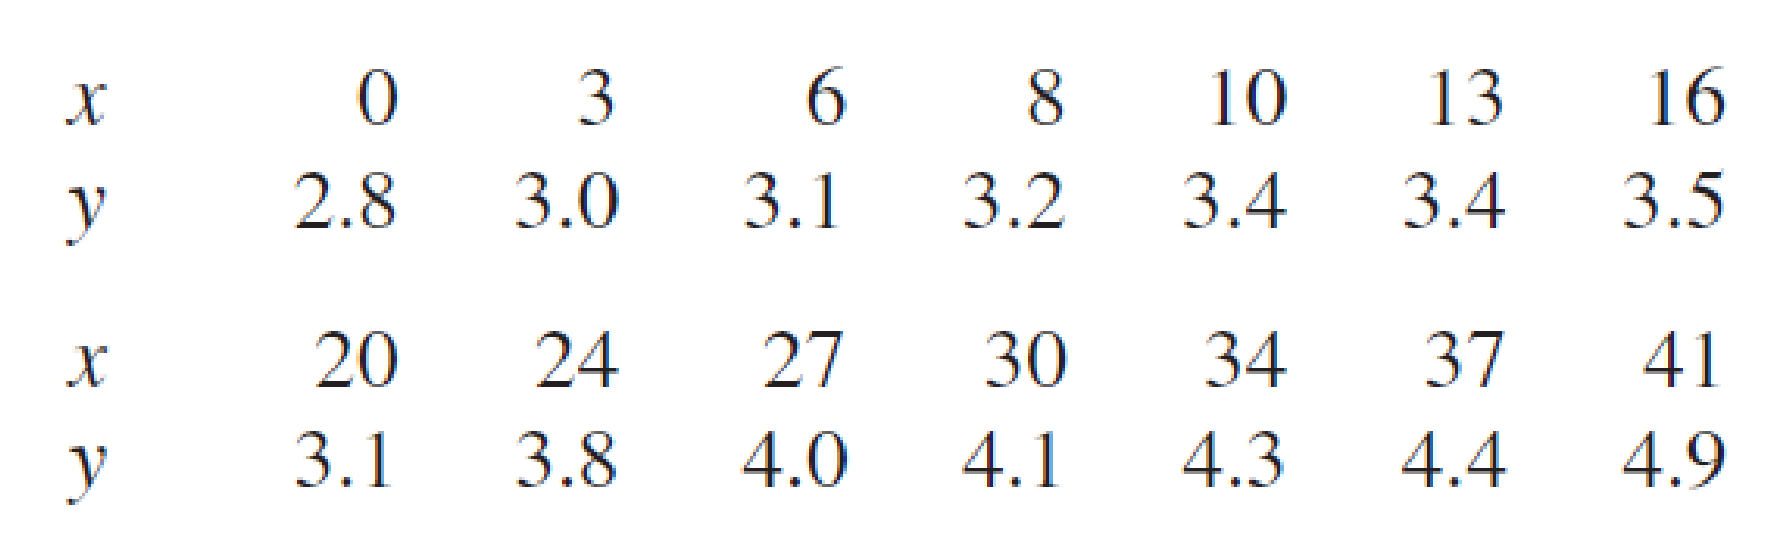
- a. Summary quantities are
Find the equation of the estimated regression line for predicting moisture content from time on the shelf.
- b. Does the simple linear regression model provide useful information for predicting moisture content from knowledge of shelf time?
- c. Find a 95% interval for the moisture content of an individual box of cereal that has been on the shelf 30 days.
- d. According to the article, taste tests indicate that this brand of cereal is unacceptably soggy when the moisture content exceeds 4.1. Based on your interval in Part (c), do you think that a box of cereal that has been on the shelf 30 days will be acceptable? Explain.

Trending nowThis is a popular solution!

Chapter 13 Solutions
Introduction To Statistics And Data Analysis


- A study is made for a particular allergy medication in order to determine the length of relief it provides Y (in hours) in relation to the dosage of medication X (in mg). For this reason, ten patients were given different doses of the medication and were asked to report back when the medication seemed to wear off. Patient #1 #2 #3 #4 #5 #6 #7 #8 #9 #10 Dosage (x) Relief Hours (y) 3 3.5 4 5 6 6.5 7 8 8.5 9 9.1 5.5 12.3 9.2 14.2 16.8 22.0 18.3 24.5 22.7 (i) Draw a scatter diagram. (ii) Calculate the product moment correlation coefficient and comment on your answer. (iii) Construct the least squares regression line.arrow_forwardIs at least one of the two variables (weight and horsepower) significant in the model?arrow_forward#b. Develop an estimated regression equation with both television advertising and newspaper advertising as the independent variables (to 2 decimals).arrow_forward
- Cell Phone Radiation Listed below are the measured radiation absorption rates (in W/kg) corresponding to these cell phones: iPhone 5S, BlackBerry Z30, Sanyo Vero, Optimus V, Droid Razr, Nokia N97, Samsung Vibrant, Sony Z750a, Kyocera Kona, LG G2, and Virgin Mobile Supreme. The data are from the Federal Communications Commission. If one of each model of cell phone is measured for radiation and the results are used to find the measures of variation, are the results typical of the population of cell phones that are in use?arrow_forwardThe relationship between sleep hours and overall happiness level on the next day was estimated as below in a linear format. (Happiness level is measured through a five-point scale: 1 = Extremely unhappy, 5 = Extremely happy) Overall happiness level = 0.27 * Sleep hours + 2.34 (The p-value for the coefficient of Sleep hours is 0.02.) Based on this equation, what is the expected happiness level of a person on a certain day, when he slept 7 hours the day before?arrow_forwardThe table below shows the number of state-registered automatic weapons and the murder rate for several Northwestern states. xx 11.8 8.6 7.1 3.9 2.5 2.6 2.4 0.4 yy 14.3 11.5 9.8 7.6 6.2 6.5 6.4 4.1 xx = thousands of automatic weaponsyy = murders per 100,000 residentsThis data can be modeled by the equation y=0.86x+4.07.y=0.86x+4.07. Use this equation to answer the following; Special Note: I suggest you verify this equation by performing linear regression on your calculator.A) How many murders per 100,000 residents can be expected in a state with 3 thousand automatic weapons?Answer = Round to 3 decimal places.B) How many murders per 100,000 residents can be expected in a state with 4.1 thousand automatic weapons?Answer = Round to 3 decimal places.arrow_forward
 Algebra & Trigonometry with Analytic GeometryAlgebraISBN:9781133382119Author:SwokowskiPublisher:Cengage
 Trigonometry (MindTap Course List)TrigonometryISBN:9781337278461Author:Ron LarsonPublisher:Cengage Learning
 Functions and Change: A Modeling Approach to Coll...AlgebraISBN:9781337111348Author:Bruce Crauder, Benny Evans, Alan NoellPublisher:Cengage Learning