
Videos
Efficient design of certain types of municipal waste incinerators requires that information about energy content of the waste be available. The authors of the article “Modeling the Energy Content of Municipal Solid Waste Using Multiple
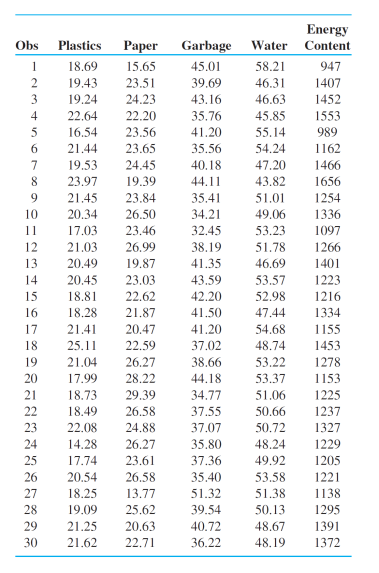
Using Minitab to fit a multiple regression model with the four aforementioned variables as predictors of energy content resulted in the following output:
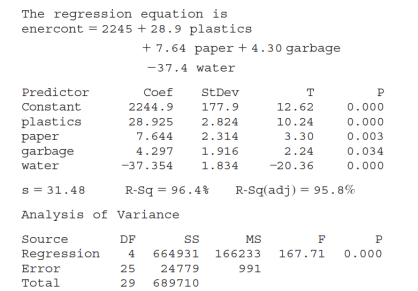
a. Interpret the values of the estimated regression coefficients
b. State and test the appropriate hypotheses to decide whether the model fit to the data specifies a useful linear relationship between energy content and at least one of the four predictors.
c. Given that % plastics, % paper, and % water remain in the model, does % garbage provide useful information about energy content? State and test the appropriate hypotheses using a significance level of .05.
d. Use the fact that
e. Use the information given in part (d) to predict energy content for a waste sample having the specified characteristics, in a way that conveys information about precision and reliability.
Want to see the full answer?
Check out a sample textbook solution
Chapter 13 Solutions
Probability and Statistics for Engineering and the Sciences


- The table contains data on vehicle speed (h) and fuel consumption (lt / 100km) of 5 randomly selected vehicles. Estimate the average fuel consumption of a vehicle traveling at 45 km / h using the simple linear regression equation between vehicle speed and fuel consumption. Speed 55 60 65 70 75 Consumption 13 12 11 10 9 a. 15 b. 8 c. 7 d. 20arrow_forwardIn a certain type of metal test specimen, the normal stress on a specimen is known tobe functionally related to the shear resistance. The following is a set of codedexperimental data on the two variables:Normal stress (X) 26.8 25.4 28.9 23.6 27.7 23.9 24.7Shear resistance (Y) 26.5 27.3 24.2 27.1 23.6 25.9 26.3i) Estimate the linear regression line and interpret regressioncoefficient.ii) Comment about of goodness of fit of the estimated regression line.arrow_forwardA random sample of twelve students were chosen, and their midterm test score (y), as- signment score (x1), and missed classes (x2) were recorded as follows: Midterm Score, y Assignment Score, x1 Classes Missed, x2 85 74 76 90 85 87 94 98 81 91 76 74 65 50 55 65 55 70 65 70 55 70 50 55 5 7 5 2 6 3 2 5 4 3 1 4 (i) What is the fitted multiple linear regression equation of the form yˆ = b0 + b1x1 + b2x2? (ii) From part (i) above, estimate the midterm test score grade for a student who has an assignment score of 60 and missed 4 classes.arrow_forward
- The marketing manager of a supermarket chain would like to determine the effect of shelf spaceon the sales of pet food. A random sample of 10 stores was selected, and the results are presentedbelow. Store shelf space in cm weekly sales in thousand pesos 1 45 18 2 45 21 3 75 15 4 80 18 5 95 23 6 100 26 7 135 22 8 140 27 9 185 25 10 190 28 d. Using the estimated simple linear regression equation Y=15.6414+0.0611X, estimate the weekly sales when theshelf space is 230cm? 250cm? e. Compute the coefficient of determination and interpret its value.arrow_forwardThe table contains data on vehicle speed (h) and fuel consumption (lt / 100km) of 5 randomly selected vehicles. Estimate the average fuel consumption of a vehicle traveling at 45 km / h using the simple linear regression equation between vehicle speed and fuel consumption. Speed 55 60 65 70 75 Consumption 11 10 9 8 7 Please choose one: a. 6 b. 5 c. 13 D. 8arrow_forwardThe Update to the Task Force Report on Blood Pressure Control in Children [12] reported the observed 90th per-centile of SBP in single years of age from age 1 to 17 based on prior studies. The data for boys of average height are given in Table 11.18. Suppose we seek a more efficient way to display the data and choose linear regression to accomplish this task. age sbp 1 99 2 102 3 105 4 107 5 108 6 110 7 111 8 112 9 114 10 115 11 117 12 120 13 122 14 125 15 127 16 130 17 132 Do you think the linear regression provides a good fit to the data? Why or why not? Use residual analysis to justify your answer. Am I supposed to run a residual plot and QQ-plot for this question?arrow_forward
- A group of Maternal and Child Health public health practitioners are interested in the relationship between bacterial vaginosis (BV) and a number of negative health outcomes. Suppose the research team gathers information on a group of participants, and constructs a multiple linear regression model looking at the relationship between BV and depression, controlling for maternal age. The following is a computerized output displaying the results of their analysis.Parameter Intercept Maternal Age DepressionEstimate StandardError tValue Pr>|t|0.2186206635 -.0046496845 0.19124124150.06635040 0.00221338 0.031518843.29 0.0010 -2.10 0.0360 6.07 <.0001 A) What are the dependent and independent variables in this investigation?B) Based on the information above, was the research team justified in controlling for maternal age in this population? Why or why not?C) Write out the model in symbols. Round to 3 decimal places.D) Is there a significant association between BV and depression?arrow_forwardInterpret the estimated regression coefficient corresponding to the Z variable. Data Salary Education Experience Sex 29.7985 15 3 1 21.8219 4 0 0 22.8978 4 0 0 22.0917 1 1 0 21.8993 5 0 0 22.4829 3 1 1 28.0772 15 0 0 y=salary 23.6292 6 1 1 x1=education level in schooling years 32.3595 0 15 1 x2=experience level in employment level 21.794 1 0 0 d=sex (1 for male,0 for female) 19.8762 3 0 0 Ln(Y) = alpha +beta1X1 +Beta2X2+ Beta3D +Beta4Z +e 21.0253 3 0 0 where z =X2D 24.6323 0 5 1 19.0247 0 0 0 18.8857 0 0 0 21.8552 1 0 0 24.2675 6 1 0 18.7931 0 0 0 18.9276 0 0 0 23.4441 5 1 1 20.8047 2 0 0 18.26 0 0 0 20.6726 0 2 1 21.7815 3 0 0…arrow_forwardThe accompanying data resulted from an experiment in which weld diameter and shear strength (in pounds) were determined for five different spot welds on steel. Below are the data collected and the regression equation. Diameter Strength 200.1 813.7 210.1 785.3 220.1 960.4 230.1 1118.0 240.0 1076.2 Strength = -941.6992 + 8.5988*Diameter The predicted y-hat value for a diameter of 201 is 864. if we observed a weld that had a diameter of 235 that had a strength 1000, what would be its residual?arrow_forward
- A sixth-grade teacher believes that there is a relationship between his students’ IQscores (y) and the numbers of hours (x) they spend watching television each week. Thefollowing table shows a random sample of 7 sixth-grade students.y 125 116 97 114 85 107 105x 5 10 30 16 41 28 21 Does the data provide sufficient evidence to indicate that the simple linear regressionmodel is appropriate to describe the relationship between x and y? Perform a model utilitytest at α = 0.05. (Give H0, Ha, rejection region, observed test statistic, P-value, decisionand conclusion.)Find the Pearson sample correlation coefficient between x and y. Then interpretthe result.arrow_forwardA student used multiple regression analysis to study how family spending (y) is influenced by income(x1), family size (x2), and additionsto savings(x3). The variables y, x1, and x3 are measured in thousandsof dollars. The following results were obtained. ANOVA df SSRegression 3 45.9634Residual 11 2.6218Total Coefficients Standard Error Intercept 0.0136x1 0.7992 0.074 x2 0.2280 0.190 x3 -0.5796 0.920 -Write out the estimated regression equation for the relationship between the variables. (1mark)-Compute coefficient of determination. What can you say about the strength of thisrelationship? -Carry out a test to determine whether y is significantly related to the independent variables.Use a 5% level of significance.-Carry out a test to see if x3 and y are significantly related. Use a 5% level of significance.arrow_forwardThe article “Models for Assessing Hoisting Times of Tower Cranes” (A. Leung and C. Tam, Journal of Construction Engineering and Management, 1999: 385–391) presents a model constructed by a stepwise regression procedure to predict the time needed for a tower crane hoisting operation. Twenty variables were considered, and the stepwise procedure chose a nine-variable model. The adjusted R2 for the selected model was 0.73. True or false: a) The value 0.73 is a reliable measure of the goodness of fit of the selected model. b) The value 0.73 may exaggerate the goodness of fit of the model. c) A stepwise regression procedure selects only variables that are of some use in predicting the value of the dependent variable. d) It is possible for a variable that is of no use in predicting the value of a dependent variable to be part of a model selected by a stepwise regression procedure.arrow_forward
 MATLAB: An Introduction with ApplicationsStatisticsISBN:9781119256830Author:Amos GilatPublisher:John Wiley & Sons Inc
 Probability and Statistics for Engineering and th...StatisticsISBN:9781305251809Author:Jay L. DevorePublisher:Cengage Learning
 Statistics for The Behavioral Sciences (MindTap C...StatisticsISBN:9781305504912Author:Frederick J Gravetter, Larry B. WallnauPublisher:Cengage Learning
 Elementary Statistics: Picturing the World (7th E...StatisticsISBN:9780134683416Author:Ron Larson, Betsy FarberPublisher:PEARSON
 The Basic Practice of StatisticsStatisticsISBN:9781319042578Author:David S. Moore, William I. Notz, Michael A. FlignerPublisher:W. H. Freeman
 Introduction to the Practice of StatisticsStatisticsISBN:9781319013387Author:David S. Moore, George P. McCabe, Bruce A. CraigPublisher:W. H. Freeman