Videos
Given the bivariate data:
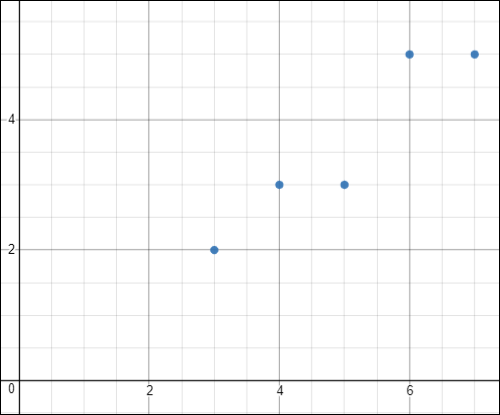
a. Draw a scatter diagram for the data.
b. Find
c. Find a. the slope of the least-squares line, and b, the y-intercept of the least-squares line.
d. Draw the least-squares line on the scatter diagram from part a.
e. Is the point
f. Use the equation of the least-squares line to predict the value of y when
g. Find, to the nearest hundredth, the linear

Trending nowThis is a popular solution!

Chapter 13 Solutions
Mathematical Excursions (MindTap Course List)


 Glencoe Algebra 1, Student Edition, 9780079039897...AlgebraISBN:9780079039897Author:CarterPublisher:McGraw Hill
 Holt Mcdougal Larson Pre-algebra: Student Edition...AlgebraISBN:9780547587776Author:HOLT MCDOUGALPublisher:HOLT MCDOUGAL