
Concept explainers
Videos
Consider the following pH curves for 100.0 mL of two different acids with the same initial concentration each titrated by 0.10 M NaOH.
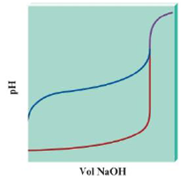
a. Which plot represents a pH curve of a weak acid, and which plot is for a strong acid? How can you tell? Cite three differences between the plots that help you decide.
b. In both cases the pH is relatively constant before the pH changes greatly. Does this mean that at some point in each titration each solution was a buffered solution?
c. True or false? The equivalence point volume for each titration is the same. Explain your answer.
d. True or false? The pH at the equivalence point for each titration is the same. Explain your answer.
Want to see the full answer?
Check out a sample textbook solution
Chapter 14 Solutions
Chemistry: An Atoms First Approach
Additional Science Textbook Solutions
Fundamentals of Heat and Mass Transfer
General Chemistry: Atoms First
Basic Chemistry (5th Edition)
Chemistry In Context
Inorganic Chemistry
Chemistry: An Introduction to General, Organic, and Biological Chemistry (13th Edition)


- Consider the following pH curves for 100.0 mL of two different acids with the same initial concentration each titrated by 0.10 M NaOH. a. Which plot represents a pH curve of a weak acid, and which plot is for a strong acid? How can you tell? Cite three differences between the plots that help you decide. b. In both cases the pH is relatively constant before the pH changes greatly. Does this mean that at some point in each titration each solution was a buffered solution? c. True or false? The equivalence point volume for each titration is the same. Explain your answer. d. True or false? The pH at the equivalence point for each titration is the same. Explain your answer.arrow_forwardThe titration curves for two acids with the same base are shown on this graph. (a) Which is the curve for the weaker acid? Explain your choice. (b) Give the approximate pH at the equivalence point for the titration of each acid. (c) Explain why the pH at the equivalence point differs for each acid. (d) Explain why the starting pH values of the two acids differ. (e) Which indicator or indicators, phenolphthalein, bromthymol blue, or methyl red, could be used for the titration of Acid 1? For the titration of Acid 2? Explain your choices.arrow_forwardEach of the solutions in the table has the same volume and the same concentration, 0.1 M. Which solution requires the greatest volume of 0.1-M NaOH to titrate to the equivalence point? Explain your answer.arrow_forward
- Consider the titration of butyric acid (HBut) with sodium hydroxide. In an experiment, 50.00 mL of 0.350 M butyric acid is titrated with 0.225 M NaOH. Ka HBut=1.5105. (a) Write a balanced net ionic equation for the reaction that takes place during titration. (b) What are the species present at the equivalence point? (c) What volume of sodium hydroxide is required to reach the equivalence point? (d) What is the pH of the solution before any NaOH is added? (e) What is the pH of the solution halfway to the equivalence point? (f) What is the pH of the solution at the equivalence point?arrow_forwardMarble is almost pure CaCO3. Acid rain has a devastating effect on marble statuary left outdoors. Assume that the reaction which occurs is CoCO3(s)+ H+(aq)Ca2+(aq)+HCO3(aq) Neglecting all other competing equilibria and using Tables 15.1 and 13.2, calculate (a) K for the reaction. (b) the molar solubility of CaCO3 in pure water. (c) the molar solubility of CaCO3 in acid rainwater with a pH of 4.00.arrow_forwardWhen 40.00 mL of a weak monoprotic acid solution is titrated with 0.100-M NaOH, the equivalence point is reached when 35.00 mL base has been added. After 20.00 mL NaOH solution has been added, the titration mixture has a pH of 5.75. Calculate the ionization constant of the acid.arrow_forward
- Consider the titration of 100.0 mL of 0.100 M HCN by 0.100 M KOH at 25C. (Ka for HCN = 6.2 1010.) a. Calculate the pH after 0.0 mL of KOH has been added. b. Calculate the pH after 50.0 mL of KOH has been added. c. Calculate the pH after 75.0 mL of KOH has been added. d. Calculate the pH at the equivalence point. e. Calculate the pH after 125 mL of KOH has been added.arrow_forwardA buffer is composed of formic acid and its conjugate base, the formate ion. (a) What is the pH of a solution that has a formic acid concentration of 0.050 M and a sodium formate concentration of 0.035 M? (b) What must the ratio of acid to conjugate base be to have a pH value 0.50 units higher than the value calculated in part (a)?arrow_forwardYou titrate 25.0 mL of 0.10 M NH3 with 0.10 M HCl. (a) What is the pH of the NH3 solution before the titration begins? (b) What is the pH at the equivalence point? (c) What is the pH at the halfway point of the titration? (d) What indicator in Figure 17.11 could be used to detect the equivalence point? (e) Calculate the pH of the solution after adding 5.00, 15.0, 20.0, 22.0, and 30.0 mL of the acid. Combine this information with that in parts (a)(c) and plot the titration curve.arrow_forward
- Consider the nanoscale-level representations for Question 110 of the titration of the aqueous weak acid HX with aqueous NaOH, the titrant. Water molecules and Na+ ions are omitted for clarity. Which diagram corresponds to the situation: After a very small volume of titrant has been added to the initial HX solution? When enough titrant has been added to take the solution just past the equivalence point? Halfway to the equivalence point? At the equivalence point? Nanoscale representations for Question 110.arrow_forwardFor the titration of 50.0 mL of 0.150 M ethylamine. C2H5NH2, with 0.100 M HCl, find the pH at each of the following points, and then use that information to sketch the titration curve and decide on an appropriate indicator. (a) At the beginning, before HCl is added (b) At the halfway point in the titration (c) When 75% of the required acid has been added (d) At the equivalence point (e) When 10.0 mL more HCl has been added than is required (f) Sketch the titration curve. (g) Suggest an appropriate indicator for this titration.arrow_forward
 ChemistryChemistryISBN:9781305957404Author:Steven S. Zumdahl, Susan A. Zumdahl, Donald J. DeCostePublisher:Cengage Learning
 Chemistry: An Atoms First ApproachChemistryISBN:9781305079243Author:Steven S. Zumdahl, Susan A. ZumdahlPublisher:Cengage Learning
 Chemistry: Principles and ReactionsChemistryISBN:9781305079373Author:William L. Masterton, Cecile N. HurleyPublisher:Cengage Learning
 Chemistry: The Molecular ScienceChemistryISBN:9781285199047Author:John W. Moore, Conrad L. StanitskiPublisher:Cengage Learning
 Chemistry for Engineering StudentsChemistryISBN:9781337398909Author:Lawrence S. Brown, Tom HolmePublisher:Cengage Learning