
Concept explainers
Videos
Insured Social Security workers. Workers insured under the Social Security program are categorized as fully and permanently insured, fully but not permanently insured, or insured in the
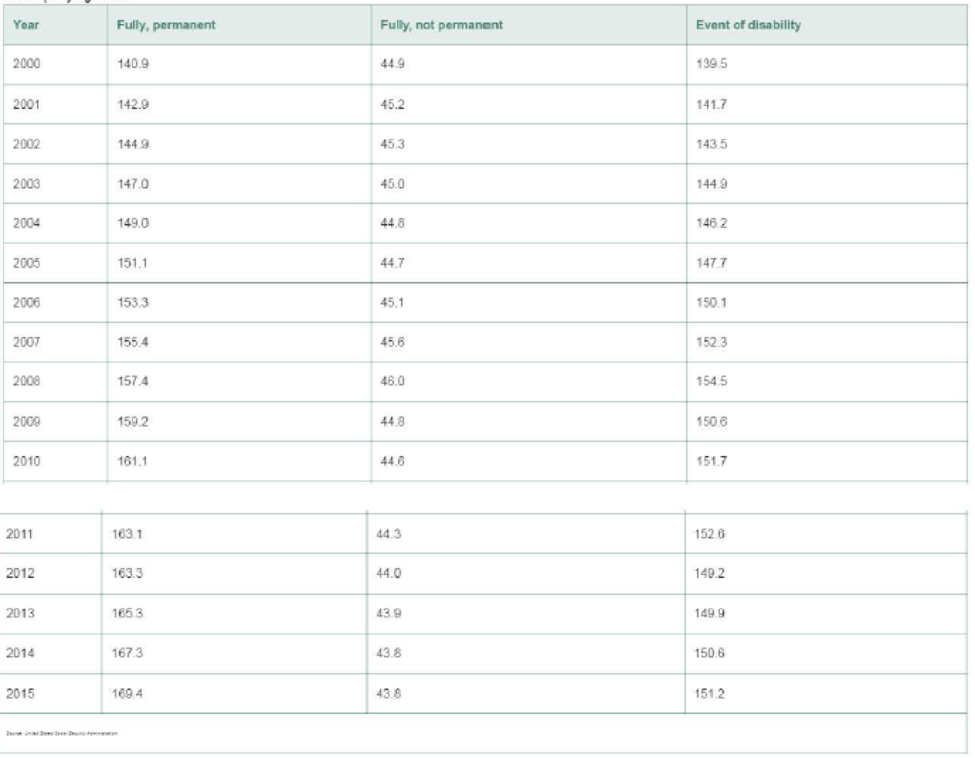
a. Compute a simple composite index for the number of workers in the three insured categories using 2000 as the base period.
b. Is the index, part a, a price index or a quantity index?
c. Refer to part a. Interpret the index value for 2015.
a.
To compute: The simple composite index for the number of workers in the three insured categories using 2000 as the base period.
Answer to Problem 14.58ACB
The simple composite index for the number of workers in the three insured categories using 2000 as the base period is,
| Year | Fully Permanent | Fully Not Permanent | Event Disability | Index |
| 2000 | 140.9 | 44.9 | 139.5 | 100.0 |
| 2001 | 142.9 | 45.2 | 141.7 | 101.4 |
| 2002 | 144.9 | 45.3 | 143.5 | 102.6 |
| 2003 | 147 | 45 | 144.9 | 103.6 |
| 2004 | 149 | 44.8 | 146.2 | 104.5 |
| 2005 | 151.1 | 44.7 | 147.7 | 105.6 |
| 2006 | 153.3 | 45.1 | 150.1 | 107.1 |
| 2007 | 155.4 | 45.6 | 152.3 | 108.6 |
| 2008 | 157.4 | 46 | 154.5 | 110.0 |
| 2009 | 159.2 | 44.8 | 150.6 | 109.0 |
| 2010 | 161.1 | 44.6 | 151.7 | 109.9 |
| 2011 | 163.1 | 44.3 | 152.6 | 110.7 |
| 2012 | 163.3 | 44 | 149.2 | 109.6 |
| 2013 | 165.3 | 43.9 | 149.9 | 110.4 |
| 2014 | 167.3 | 43.8 | 150.6 | 111.2 |
| 2015 | 169.4 | 43.8 | 151.2 | 112.0 |
Explanation of Solution
Given info:
The table shows that the number of workers in different categories from 2000 to 2015.
Calculation:
The total number of workers in fully and permanently insured, fully but not permanently insured or insured in the event of disability of the years 2000-2015 is obtained as follows:
The total number of workers in fully and permanently insured, fully but not permanently insured or insured in the event of disability of the 2000 is obtained by adding the number of workers in fully and permanently insured, fully but not permanently insured or insured in the event of disability of the year 2000.
Similarly the totals of the remaining years 2001-2015 is as follows:
| Year | Fully Permanent | Fully Not Permanent | Event Disability | Sum |
| 2000 | 140.9 | 44.9 | 139.5 | 325.3 |
| 2001 | 142.9 | 45.2 | 141.7 | 329.8 |
| 2002 | 144.9 | 45.3 | 143.5 | 333.7 |
| 2003 | 147 | 45 | 144.9 | 336.9 |
| 2004 | 149 | 44.8 | 146.2 | 340.0 |
| 2005 | 151.1 | 44.7 | 147.7 | 343.5 |
| 2006 | 153.3 | 45.1 | 150.1 | 348.5 |
| 2007 | 155.4 | 45.6 | 152.3 | 353.3 |
| 2008 | 157.4 | 46 | 154.5 | 357.9 |
| 2009 | 159.2 | 44.8 | 150.6 | 354.6 |
| 2010 | 161.1 | 44.6 | 151.7 | 357.4 |
| 2011 | 163.1 | 44.3 | 152.6 | 360.0 |
| 2012 | 163.3 | 44 | 149.2 | 356.5 |
| 2013 | 165.3 | 43.9 | 149.9 | 359.1 |
| 2014 | 167.3 | 43.8 | 150.6 | 361.7 |
| 2015 | 169.4 | 43.8 | 151.2 | 364.4 |
The formula to find the simple composite index is,
For year 2000:
The simple composite index for the number of workers in the three insured categories for year 2000 using 2000 as the base period is as follows:
Substitute 325.3 for “Sum value at time t” and 325.3 for “Time series value at base period”
Similarly, the simple composite index for the remaining years using 2000 as the base year is as follows:
| Year | Fully Permanent | Fully Not Permanent | Event Disability | Sum | Simple Composite Index-2000 |
| 2000 | 140.9 | 44.9 | 139.5 | 325.3 | 100.0 |
| 2001 | 142.9 | 45.2 | 141.7 | 329.8 | 101.4 |
| 2002 | 144.9 | 45.3 | 143.5 | 333.7 | 102.6 |
| 2003 | 147 | 45 | 144.9 | 336.9 | 103.6 |
| 2004 | 149 | 44.8 | 146.2 | 340.0 | 104.5 |
| 2005 | 151.1 | 44.7 | 147.7 | 343.5 | 105.6 |
| 2006 | 153.3 | 45.1 | 150.1 | 348.5 | 107.1 |
| 2007 | 155.4 | 45.6 | 152.3 | 353.3 | 108.6 |
| 2008 | 157.4 | 46 | 154.5 | 357.9 | 110.0 |
| 2009 | 159.2 | 44.8 | 150.6 | 354.6 | 109.0 |
| 2010 | 161.1 | 44.6 | 151.7 | 357.4 | 109.9 |
| 2011 | 163.1 | 44.3 | 152.6 | 360.0 | 110.7 |
| 2012 | 163.3 | 44 | 149.2 | 356.5 | 109.6 |
| 2013 | 165.3 | 43.9 | 149.9 | 359.1 | 110.4 |
| 2014 | 167.3 | 43.8 | 150.6 | 361.7 | 111.2 |
| 2015 | 169.4 | 43.8 | 151.2 | 364.4 | 112.0 |
b.
To identify: Whether the index in part (a) is price index or quantity index.
Answer to Problem 14.58ACB
The index in part (a) is quantity index.
Explanation of Solution
Justification:
From the given information it can be observed that the index in part (a) represents the quantities. Thus, the index in part (a) is quantity index.
c.
To interpret: The index value for 2015.
Answer to Problem 14.58ACB
The index value for 2015 interprets that the total number of insured workers in 2015 is increased by 12.0% when the base year is 2000.
Explanation of Solution
Justification:
Here, it is observed that the total number of insured workers in 2015 is increased by 12.0%
Want to see more full solutions like this?
Chapter 14 Solutions
MyLab Statistics for Business Stats with Pearson eText -- Standalone Access Card -- for Statistics for Business and Economics


 Mathematics For Machine TechnologyAdvanced MathISBN:9781337798310Author:Peterson, John.Publisher:Cengage Learning,