
Introduction To Statistics And Data Analysis
6th Edition
ISBN: 9781337793612
Author: PECK, Roxy.
Publisher: Cengage Learning,
expand_more
expand_more
format_list_bulleted
Concept explainers
Videos
Textbook Question
Chapter 1.4, Problem 19E
An article in the New Times San Luis Obispo (February 4, 2016) reported the accompanying concussion rates for different high school sports. The given data are concussion rates per 10,000 athletes participating in high school sports in 2012.
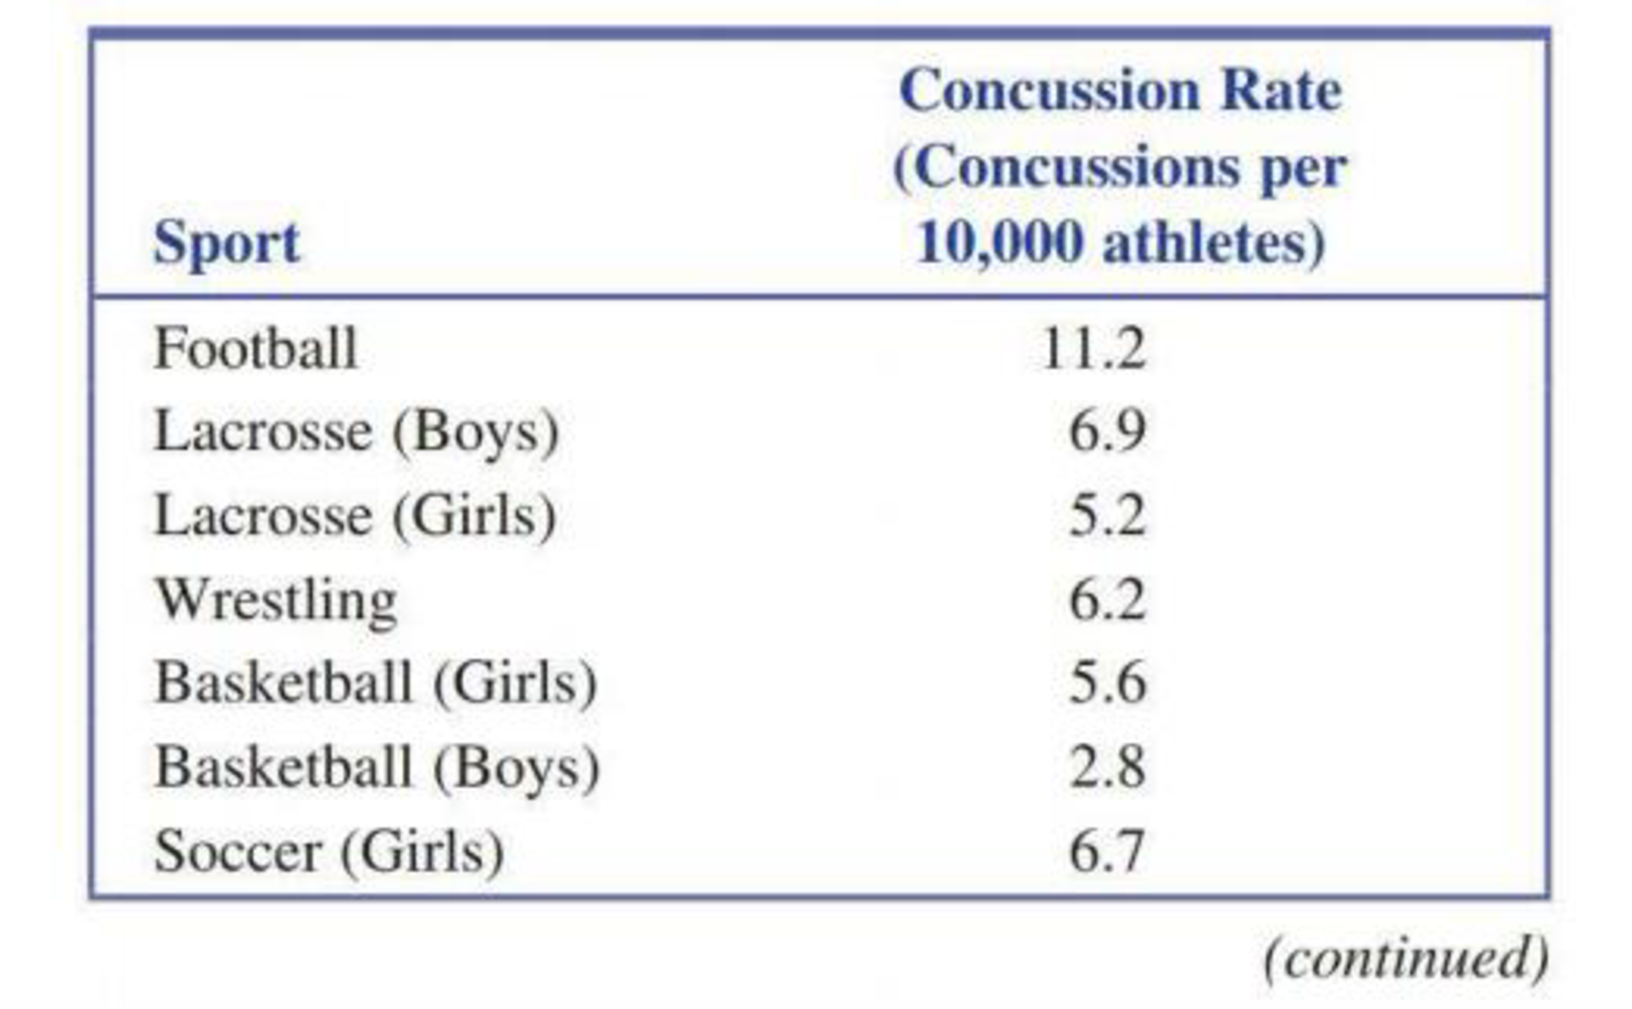
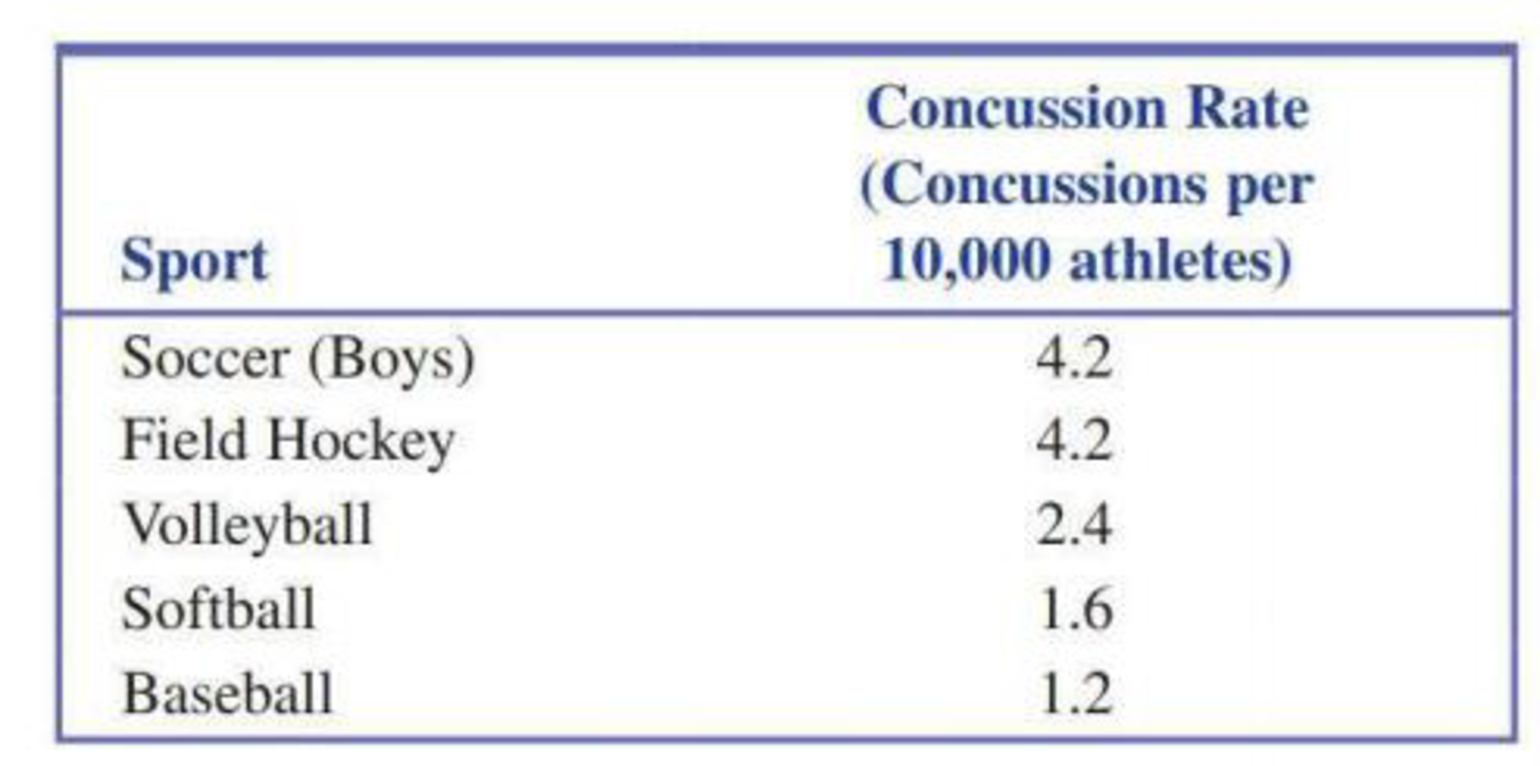
- a. Construct a dotplot of the concussion rate data.
- b. In addition to the three girls’ sports indicated in the table (lacrosse, basketball, and soccer), the reported concussion rates for field hockey, volleyball, and softball are also for girls. Locate the points on the dotplot that correspond to concussion rates for girls’ sports and highlight them in a different color. Based on the dotplot, would you say that the concussion rates for girls’ sports tend to be lower than or higher than for boys’ sports? Explain.
Expert Solution & Answer

Trending nowThis is a popular solution!

Students have asked these similar questions
The data contained in the file FoodIndustry show the company/chain name, the average sales per store ($1,000s), and the food segment industry for 47 restaurant chains.†
Company
Segment
2012 U.S.AverageSales perStore($1,000s)
Arby's
Sandwich
993
Baskin-Robbins
Snacks
207
Bojangles'
Chicken
1,718
Boston Market
Chicken
1,184
Burger King
Burger
1,195
Carl's Jr.
Burger
1,470
Checkers/Rally's
Burger
903
Chick-fil-A
Chicken
3,158
Chipotle MexicanGrill
Mexican
2,113
Church's Chicken
Chicken
707
CiCi's Pizza
Pizza/Pasta
915
Culver's
Burger
1,838
Dairy Queen
Burger
545
Del Taco
Mexican
1,100
Domino's Pizza
Pizza/Pasta
710
Dunkin' Donuts
Snacks
857
El Pollo Loco
Chicken
1,475
Five GuysBurgers & Fries
Burger
1,049
Hardee's
Burger
1,145
In-N-Out Burger
Burger
1,935
Jack in the Box
Burger
1,379
Jamba Juice
Snacks
715
Jason's Deli
Sandwich
2,556
Jimmy John's
Sandwich
879
Company
Segment
2012 U.S.AverageSales perStore($1,000s)
KFC…
Chapter 1 Solutions
Introduction To Statistics And Data Analysis
Ch. 1.3 - Give brief definitions of the terms descriptive...Ch. 1.3 - Give brief definitions of the terms population and...Ch. 1.3 - The following conclusion from a study appeared in...Ch. 1.3 - Based on a study of 2 121 children between the...Ch. 1.3 - The student senate at a university with 15,000...Ch. 1.3 - The National Retail Federation used data from a...Ch. 1.3 - The supervisors of a rural county are interested...Ch. 1.3 - A consumer group conducts crash tests of new model...Ch. 1.3 - A building contractor has a chance to buy an odd...Ch. 1.3 - The article Brain Shunt Tested to Treat Alzheimers...
Ch. 1.3 - In a study of whether taking a garlic supplement...Ch. 1.4 - Classify each of the following variables as either...Ch. 1.4 - Classify each of the following variables as either...Ch. 1.4 - For the following numerical variables, state...Ch. 1.4 - For the following numerical variables, state...Ch. 1.4 - For each of the following situations, give a set...Ch. 1.4 - In a survey of 100 people who had recently...Ch. 1.4 - The Gallup report More Americans Say Real Estate...Ch. 1.4 - An article in the New Times San Luis Obispo...Ch. 1.4 - Box Office Mojo (boxofficemojo.com) tracks movie...Ch. 1.4 - The report With Their Whole Lives Ahead of Them...Ch. 1.4 - The following display is a graph similar to one...Ch. 1.4 - The accompanying table gives the total number...Ch. 1.4 - Heal the Bay is an environmental organization that...Ch. 1.4 - The report referenced in the previous exercise...Ch. 1.4 - The U.S. Department of Health and Human Services...Ch. 1.4 - Example 1.5 gave the accompanying data on violent...Ch. 1.4 - The article Fliers Trapped on Tarmac Push for...Ch. 1.4 - The report Trends m Community Colleges...Ch. 1.4 - The article Where College Students Buy Textbooks...Ch. 1.4 - Prob. 31ECh. 1.4 - In the United States, movies are rated by the...Ch. 1 - The report Testing the Waters 2009 (nrdc.org)...Ch. 1 - The U.S. Department of Education reported that 14%...Ch. 1 - The Computer Assisted Assessment Center at the...Ch. 1 - The article Just How Safe Is That Jet? (USA TODAY,...Ch. 1 - Each year, U.S. News and World Report publishes a...Ch. 1 - Many adolescent boys aspire to be professional...
Knowledge Booster


Learn more about
Need a deep-dive on the concept behind this application? Look no further. Learn more about this topic, statistics and related others by exploring similar questions and additional content below.Recommended textbooks for you
 Glencoe Algebra 1, Student Edition, 9780079039897...AlgebraISBN:9780079039897Author:CarterPublisher:McGraw Hill
 Holt Mcdougal Larson Pre-algebra: Student Edition...AlgebraISBN:9780547587776Author:HOLT MCDOUGALPublisher:HOLT MCDOUGAL
Glencoe Algebra 1, Student Edition, 9780079039897...
Algebra
ISBN:9780079039897
Author:Carter
Publisher:McGraw Hill
Holt Mcdougal Larson Pre-algebra: Student Edition...
Algebra
ISBN:9780547587776
Author:HOLT MCDOUGAL
Publisher:HOLT MCDOUGAL
The Shape of Data: Distributions: Crash Course Statistics #7; Author: CrashCourse;https://www.youtube.com/watch?v=bPFNxD3Yg6U;License: Standard YouTube License, CC-BY
Shape, Center, and Spread - Module 20.2 (Part 1); Author: Mrmathblog;https://www.youtube.com/watch?v=COaid7O_Gag;License: Standard YouTube License, CC-BY
Shape, Center and Spread; Author: Emily Murdock;https://www.youtube.com/watch?v=_YyW0DSCzpM;License: Standard Youtube License