
Cornerstones of Cost Management (Cornerstones Series)
4th Edition
ISBN: 9781305970663
Author: Don R. Hansen, Maryanne M. Mowen
Publisher: Cengage Learning
expand_more
expand_more
format_list_bulleted
Videos
Textbook Question
Chapter 14, Problem 21E
At the end of 20x5, Bing Pharmaceuticals began to implement an environmental quality management program. As a first step, it identified the following costs in its accounting records as environmentally related for the calendar year just ended:
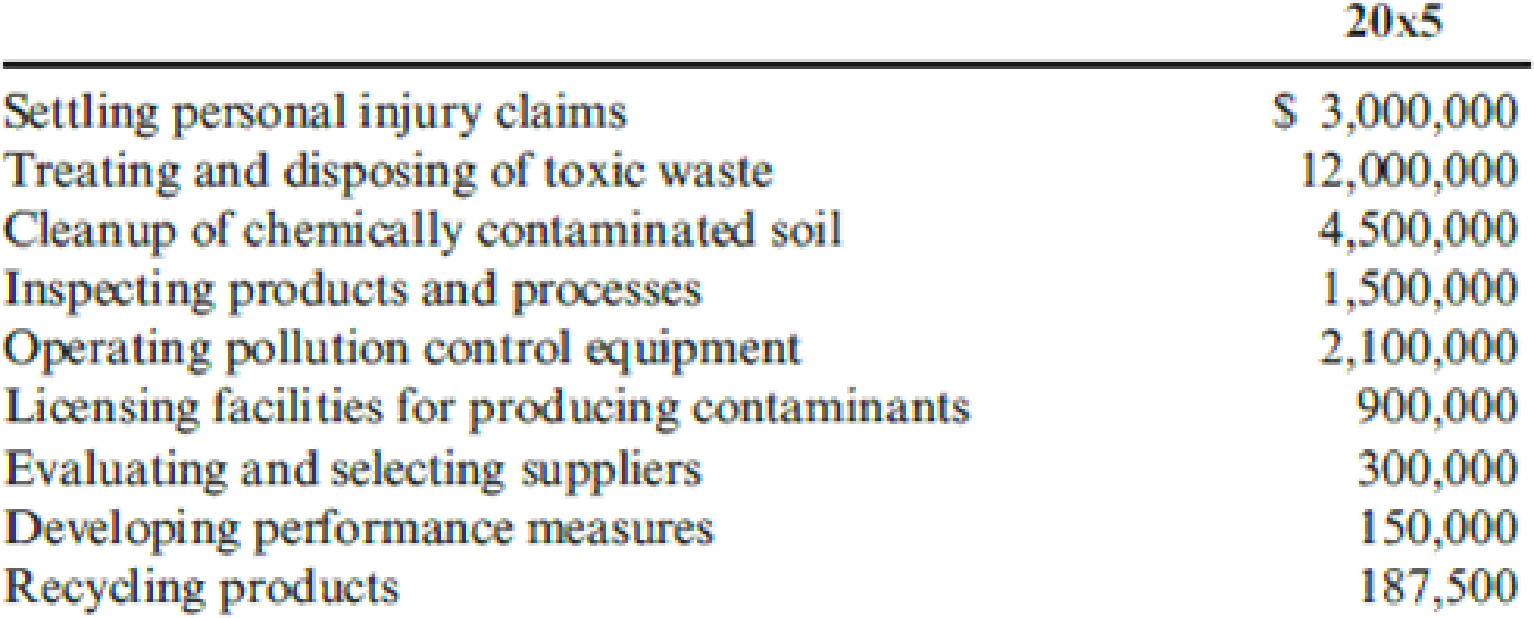
Required:
- 1. Prepare an environmental cost report by category. Assume that total operating costs are $150,000,000.
- 2. Use a pie chart to illustrate the relative distribution percentages for each environmental cost category. Comment on what this distribution communicates to a manager.
Expert Solution & Answer

Trending nowThis is a popular solution!

Chapter 14 Solutions
Cornerstones of Cost Management (Cornerstones Series)
Ch. 14 - What is the difference between quality of design...Ch. 14 - Why are quality costs the costs of doing things...Ch. 14 - Prob. 3DQCh. 14 - Describe the Taguchi quality loss function, and...Ch. 14 - Identify and discuss the four kinds of quality...Ch. 14 - Explain why external failure costs can be more...Ch. 14 - Prob. 7DQCh. 14 - Prob. 8DQCh. 14 - Describe the three types of quality performance...Ch. 14 - Prob. 10DQ
Ch. 14 - If a firms annual sales are 200 million, what...Ch. 14 - Explain why it is important for a manager to...Ch. 14 - Prob. 13DQCh. 14 - Explain why the Accounting Department should be...Ch. 14 - Prob. 15DQCh. 14 - What is ecoefficiency?Ch. 14 - Prob. 17DQCh. 14 - Prob. 18DQCh. 14 - Prob. 19DQCh. 14 - What are the four categories of environmental...Ch. 14 - Prob. 21DQCh. 14 - What does full environmental costing mean? Full...Ch. 14 - What information is communicated by the unit...Ch. 14 - Evans Company had total sales of 3,000,000 for...Ch. 14 - Prob. 2CECh. 14 - Ross Company implemented a quality improvement...Ch. 14 - Nabors Company had actual quality costs for the...Ch. 14 - Verde Company reported operating costs of...Ch. 14 - Pinter Company had the following environmental...Ch. 14 - Rachel Boyce, president of a company that...Ch. 14 - Quality attributes such as performance and...Ch. 14 - Stahman, Inc., estimates its hidden external...Ch. 14 - Prob. 10ECh. 14 - Abernathy, Inc., produces two different generators...Ch. 14 - Kang Company reported sales of 3,240,000 in 20x5....Ch. 14 - Gagnon Company reported the following sales and...Ch. 14 - Muskogee Company had sales of 60,000,000 in 20x1....Ch. 14 - Javier Company has sales of 8 million and quality...Ch. 14 - In 20x4, Tru-Delite Frozen Desserts, Inc.,...Ch. 14 - Prob. 17ECh. 14 - Prob. 18ECh. 14 - Achieving sustainable development will likely...Ch. 14 - Classify the following environmental activities as...Ch. 14 - At the end of 20x5, Bing Pharmaceuticals began to...Ch. 14 - Prob. 22ECh. 14 - Coyle Pharmaceuticals produces two organic...Ch. 14 - Prob. 24ECh. 14 - Which of the following quality costs is an...Ch. 14 - Which of the following would be a hidden quality...Ch. 14 - Using the Taguchi quality loss function, an...Ch. 14 - Environmental costs are those costs incurred...Ch. 14 - Two products, Product A and Product B, are...Ch. 14 - Kathy Shorts, president of Oliver Company, was...Ch. 14 - Panguitch Company manufactures a component for...Ch. 14 - Gaston Company manufactures furniture. One of its...Ch. 14 - Classify the following quality costs as...Ch. 14 - Wayne Johnson, president of Banshee Company,...Ch. 14 - Recently, Ulrich Company received a report from an...Ch. 14 - In 20x5, Major Company initiated a full-scale,...Ch. 14 - Paper Products Division produces paper diapers,...Ch. 14 - In 2011, Milton Thayne, president of Carbondale...Ch. 14 - Iona Company, a large printing company, is in its...Ch. 14 - Prob. 40PCh. 14 - The following items are listed in an environmental...Ch. 14 - Refer to Problem 14.41. In the environmental...Ch. 14 - The following environmental cost reports for 20x3,...Ch. 14 - Refer to Problem 14.43. In 20x3, Jack Carter,...
Knowledge Booster


Learn more about
Need a deep-dive on the concept behind this application? Look no further. Learn more about this topic, accounting and related others by exploring similar questions and additional content below.Similar questions
- Nabors Company had actual quality costs for the year ended June 30, 20x5, as given below. At the zero-defect state, Nabors expects to spend 375,000 on quality engineering, 75,000 on vendor certification, and 50,000 on packaging inspection. Assume sales to be 25,000,000. Required: 1. Prepare a long-range performance report for 20x5. What does this report tell the management of Nabors? 2. Explain why quality costs still are present for the zero-defect state. 3. What if Nabors achieves the zero-defect state reflected in the report? What are some of the implications of this achievement?arrow_forwardThe following environmental cost reports for 20x3, 20x4, and 20x5 (year end December 31) are for the Communications Products Division of Kartel, a telecommunications company. In 2011, Kartel committed itself to a continuous environmental improvement program, which was implemented throughout the company. At the beginning of 20x5, Kartel began a new program of recycling nonhazardous scrap. The effort produced recycling income totaling 25,000. The marketing vice president and the environmental manager estimated that sales revenue had increased by 200,000 per year since 20x3 because of an improved public image relative to environmental performance. The companys Finance Department also estimated that Kartel saved 80,000 in 20x5 because of reduced finance and insurance costs, all attributable to improved environmental performance. All reductions in environmental costs from 20x3 to 20x5 are attributable to improvement efforts. Furthermore, any reductions represent ongoing savings. Required: 1. Prepare an environmental financial statement for 20x5 (for the Products Division). In the cost section, classify environmental costs by category (prevention, detection, etc.). 2. Evaluate the changes in environmental performance.arrow_forwardVerde Company reported operating costs of 50,000,000 as of December 31, 20x5, with the following environmental costs: Required: 1. Prepare an environmental cost report, classifying costs by quality category and expressing each as a percentage of total operating costs. What is the message of this report? 2. Prepare a pie chart that shows the relative distribution of environmental costs by category. What does this report tell you? 3. What if Verde deliberately did not include the cost of damaging the ecosystem because of solid waste disposal in its environmental cost report? Offer possible reasons for this decision. If consciously avoided, is this decision unethical?arrow_forward
- At the end of 20x1, Mejorar Company implemented a low-cost strategy to improve its competitive position. Its objective was to become the low-cost producer in its industry. A Balanced Scorecard was developed to guide the company toward this objective. To lower costs, Mejorar undertook a number of improvement activities such as JIT production, total quality management, and activity-based management. Now, after two years of operation, the president of Mejorar wants some assessment of the achievements. To help provide this assessment, the following information on one product has been gathered: Required: 1. Compute the following measures for 20x1 and 20x3: a. Actual velocity and cycle time b. Percentage of total revenue from new customers (assume one unit per customer) c. Percentage of very satisfied customers (assume each customer purchases one unit) d. Market share e. Percentage change in actual product cost (for 20x3 only) f. Percentage change in days of inventory (for 20x3 only) g. Defective units as a percentage of total units produced h. Total hours of training i. Suggestions per production worker j. Total revenue k. Number of new customers 2. For the measures listed in Requirement 1, list likely strategic objectives, classified according to the four Balance Scorecard perspectives. Assume there is one measure per objective.arrow_forwardIn 20x4, Tru-Delite Frozen Desserts, Inc., instituted a quality improvement program. At the end of 20x5, the management of the corporation requested a report to show the amount saved by the measures taken during the year. The actual sales and quality costs for 20x4 and 20x5 are as follows: Tru-Delites management believes that quality costs can be reduced to 2.5 percent of sales within the next five years. At the end of 20x9, Tru-Delites sales are projected to grow to 750,000. The projected relative distribution of quality costs at the end of 20x9 is as follows: Required: 1. Profits increased by what amount due to quality improvements made in 20x5? 2. Prepare a long-range performance report that compares the quality costs incurred at the end of 20x5 with the quality cost structure expected at the end of 20x9. 3. Are the targeted costs in the year 20x9 all value-added costs? How would you interpret the variances if the targeted costs are value-added costs? 4. What would be the profit increase in 20x9 if the 2.5 percent performance standard is met in that year?arrow_forwardPinter Company had the following environmental activities and product information: 1. Environmental activity costs 2. Driver data 3. Other production data Required: 1. Calculate the activity rates that will be used to assign environmental costs to products. 2. Determine the unit environmental and unit costs of each product using ABC. 3. What if the design costs increased to 360,000 and the cost of toxic waste decreased to 750,000? Assume that Solvent Y uses 6,000 out of 12,000 design hours. Also assume that waste is cut by 50 percent and that Solvent Y is responsible for 14,250 of 15,000 pounds of toxic waste. What is the new environmental cost for Solvent Y?arrow_forward
- Javier Company has sales of 8 million and quality costs of 1,600,000. The company is embarking on a major quality improvement program. During the next three years, Javier intends to attack failure costs by increasing its appraisal and prevention costs. The right prevention activities will be selected, and appraisal costs will be reduced according to the results achieved. For the coming year, management is considering six specific activities: quality training, process control, product inspection, supplier evaluation, prototype testing, and redesign of two major products. To encourage managers to focus on reducing non-value-added quality costs and select the right activities, a bonus pool is established relating to reduction of quality costs. The bonus pool is equal to 10 percent of the total reduction in quality costs. Current quality costs and the costs of these six activities are given in the following table. Each activity is added sequentially so that its effect on the cost categories can be assessed. For example, after quality training is added, the control costs increase to 320,000, and the failure costs drop to 1,040,000. Even though the activities are presented sequentially, they are totally independent of each other. Thus, only beneficial activities need be selected. Required: 1. Identify the control activities that should be implemented, and calculate the total quality costs associated with this selection. Assume that an activity is selected only if it increases the bonus pool. 2. Given the activities selected in Requirement 1, calculate the following: a. The reduction in total quality costs b. The percentage distribution for control and failure costs c. The amount for this years bonus pool 3. Suppose that a quality engineer complained about the gainsharing incentive system. Basically, he argued that the bonus should be based only on reductions of failure and appraisal costs. In this way, investment in prevention activities would be encouraged, and eventually, failure and appraisal costs would be eliminated. After eliminating the non-value-added costs, focus could then be placed on the level of prevention costs. If this approach were adopted, what activities would be selected? Do you agree or disagree with this approach? Explain.arrow_forwardEvans Company had total sales of 3,000,000 for fiscal 20x5. The costs of quality-related activities are given below. Required: 1. Prepare a quality cost report, classifying costs by category and expressing each category as a percentage of sales. What message does the cost report provide? 2. Prepare a bar graph and pie chart that illustrate each categorys contribution to total quality costs. Comment on the significance of the distribution. 3. What if, five years from now, quality costs are 7.5 percent of sales, with control costs being 65 percent of the total quality costs? What would your conclusion be?arrow_forwardIn 20x5, Major Company initiated a full-scale, quality improvement program. At the end of the year, Jack Aldredge, the president, noted with some satisfaction that the defects per unit of product had dropped significantly compared to the prior year. He was also pleased that relationships with suppliers had improved and defective materials had declined. The new quality training program was also well accepted by employees. Of most interest to the president, however, was the impact of the quality improvements on profitability. To help assess the dollar impact of the quality improvements, the actual sales and the actual quality costs for 20x4 and 20x5 are as follows by quality category: All prevention costs are fixed (by discretion). Assume all other quality costs are unit-level variable. Required: 1. Compute the relative distribution of quality costs for each year and prepare a pie chart. Do you believe that the company is moving in the right direction in terms of the balance among the quality cost categories? Explain. 2. Prepare a one-year trend performance report for 20x5 (compare the actual costs of 20x5 with those of 20x4, adjusted for differences in sales volume). How much have profits increased because of the quality improvements made by Major Company? 3. Estimate the additional improvement in profits if Major Company ultimately reduces its quality costs to 2.5 percent of sales revenues (assume sales of 10 million).arrow_forward
- Luna Company is a printing company and a subsidiary of a large publishing company. Luna is in its fourth year of a 5-year, quality improvement program. The program began in 20X1 as a result of a report by a consulting firm that revealed that quality costs were about 20% of sales. Concerned about the level of quality costs, Lunas top management began a 5-year plan in 20X1 with the objective of lowering quality costs to 10% of sales by the end of 20X5. Sales and quality costs for each year are as follows: Quality costs by category are expressed as a percentage of sales as follows: The detail of the 20X5 budget for quality costs is also provided. Actual quality costs for 20X4 and 20X5 are as follows: Required: 1. Prepare an interim quality cost performance report for 20X5 that compares actual quality costs with budgeted quality costs. Comment on the firms ability to achieve its quality goals for the year. 2. Prepare a single-period quality performance report for 20X5 that compares the actual quality costs of 20X4 with the actual costs of 20X5. How much did profits change because of improved quality? 3. Prepare a graph that shows the trend in total quality costs as a percentage of sales since the inception of the quality improvement program. 4. Prepare a graph that shows the trend for all four quality cost categories for 20X1 through 20X5. How does this graph help management know that the reduction in total quality costs is attributable to quality improvements? 5. Assume that the company is preparing a second 5-year plan to reduce quality costs to 2.5% of sales. Prepare a long-range quality cost performance report that compares the costs for 20X5 with those planned for the end of the second 5-year period. Assume sales of 45 million at the end of 5 years. The final planned relative distribution of quality costs is as follows: proofreading, 50%; other inspection, 13%; quality training, 30%; and quality reporting, 7%. Assume that all prevention costs are fixed and all other costs are variable (with respect to sales).arrow_forwardMuskogee Company had sales of 60,000,000 in 20x1. In 20x5, sales had increased to 75,000,000. A quality improvement program was implemented at the beginning of 20x1. Overall conformance quality was targeted for improvement. The quality costs for 20x1 and 20x5 follow. Assume any changes in quality costs are attributable to improvements in quality. Required: 1. Compute the quality cost-to-sales ratio for each year. Is this type of improvement possible? 2. Calculate the relative distribution of costs by category for 20x1. What do you think of the way costs are distributed? (A pie chart or bar graph may be of some help.) How do you think they will be distributed as the company approaches a zero-defects state? 3. Calculate the relative distribution of costs by category for 20x5. What do you think of the level and distribution of quality costs? (A pie chart or bar graph may be of some help.) Do you think further reductions are possible? 4. The quality manager for Muskogee indicated that the external failure costs reported are only the measured costs. He argued that the 20x5 external costs were much higher than those reported and that additional investment ought to be made in control costs. Discuss the validity of his viewpoint. 5. Suppose that the manager of Muskogee received a bonus equal to 10 percent of the quality cost savings each year. Do you think that gainsharing is a good or a bad idea? Discuss the risks of gainsharing.arrow_forwardThe controller of Emery, Inc. has computed quality costs as a percentage of sales for the past 5 years (20X1 was the first year the company implemented a quality improvement program). This information is as follows: Required: 1. Prepare a trend graph for total quality costs. Comment on what the graph has to say about the success of the quality improvement program. 2. Prepare a graph that shows the trend for each quality cost category. What does the graph have to say about the success of the quality improvement program? Does this graph supply more insight than the total cost trend graph does? 3. Prepare a graph that compares the trend in relative control costs versus relative failure costs. Comment on the significance of this trend.arrow_forward
arrow_back_ios
SEE MORE QUESTIONS
arrow_forward_ios
Recommended textbooks for you
 Cornerstones of Cost Management (Cornerstones Ser...AccountingISBN:9781305970663Author:Don R. Hansen, Maryanne M. MowenPublisher:Cengage Learning
 Managerial Accounting: The Cornerstone of Busines...AccountingISBN:9781337115773Author:Maryanne M. Mowen, Don R. Hansen, Dan L. HeitgerPublisher:Cengage Learning
 Managerial AccountingAccountingISBN:9781337912020Author:Carl Warren, Ph.d. Cma William B. TaylerPublisher:South-Western College Pub
 Financial And Managerial AccountingAccountingISBN:9781337902663Author:WARREN, Carl S.Publisher:Cengage Learning,
 Principles of Accounting Volume 2AccountingISBN:9781947172609Author:OpenStaxPublisher:OpenStax College
Cornerstones of Cost Management (Cornerstones Ser...
Accounting
ISBN:9781305970663
Author:Don R. Hansen, Maryanne M. Mowen
Publisher:Cengage Learning
Managerial Accounting: The Cornerstone of Busines...
Accounting
ISBN:9781337115773
Author:Maryanne M. Mowen, Don R. Hansen, Dan L. Heitger
Publisher:Cengage Learning
Managerial Accounting
Accounting
ISBN:9781337912020
Author:Carl Warren, Ph.d. Cma William B. Tayler
Publisher:South-Western College Pub
Financial And Managerial Accounting
Accounting
ISBN:9781337902663
Author:WARREN, Carl S.
Publisher:Cengage Learning,
Principles of Accounting Volume 2
Accounting
ISBN:9781947172609
Author:OpenStax
Publisher:OpenStax College
How to Estimate Project Costs: A Method for Cost Estimation; Author: Online PM Courses - Mike Clayton;https://www.youtube.com/watch?v=YQ2Wi3Jh3X0;License: Standard Youtube License