
Concept explainers
Videos
Have you ever wondered whether soccer players suffer adverse effects from hitting “headers”? The authors of the article “No Evidence of Impaired Neurocognitive Performance in Collegiate Soccer Players” (Amer. J. of Sports Med., 2002: 157–162) investigated this issue from several perspectives.
a. The paper reported that 45 of the 91 soccer players in their sample had suffered at least one concussion, 28 of 96 nonsoccer athletes had suffered at least one concussion, and only 8 of 53 student controls had suffered at least one concussion. Analyze this data and draw appropriate conclusions.
b. For the soccer players, the sample
c. Here is summary information on scores on a controlled oral word-association test for the soccer and nonsoccer athletes:
Analyze this data and draw appropriate conclusions.
d. Considering the number of prior nonsoccer concussions, the values of mean 6 sd for the three groups were .30 ± .67, .49 ± .87, and .19 ± .48. Analyze this data and draw appropriate conclusions.
a.
Analyze the given data and draw conclusions.
Answer to Problem 47SE
There is sufficient evidence to conclude that there is a difference in the proportion of concussion with respect to three groups.
Explanation of Solution
Given info:
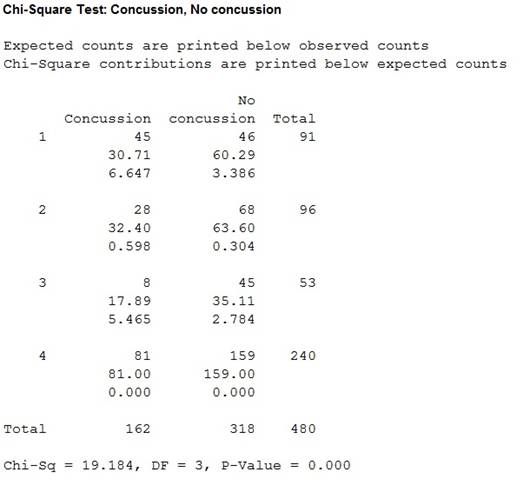
The report says that 45 out of 91 soccer players had suffered at least one concussion, 28 of 96 non-soccer athletes suffered at least one concussion and 8 of 53 students had at least one concussion.
Calculation:
From the given data the following can be observed,
| Group | Concussion | No concussion | Total |
| Soccer | 45 | 46 | 91 |
| Non soccer | 28 | 68 | 96 |
| student | 8 | 45 | 53 |
| Total | 81 | 159 | 240 |
The claim is to test whether there is any homogeneity among the proportion of concussions with respect to the three groups. If the claim is rejected, then there is no homogeneity among the proportion of concussions with respect to the three groups.
Null hypothesis:
That is, the proportion of concussions is homogenous with respect to the three groups.
Alternative hypothesis:
Test statistic:
Software procedure:
Step-by-step procedure to find the chi-square test statistic using MINITAB is given below:
- Choose Stat > Tables > Chi-Square Test (Two-Way Table in Worksheet).
- In Columns containing the table, enter the columns of Concussion and Nonconcussion.
- Click OK.
Output obtained from MINITAB is given below:
Decision rule:
If
If
Conclusion:
The P-value is 0.000 and the least level of significance is 0.001.
The P-value is lesser than the level of significance.
That is,
Thus, the null hypothesis isrejected.
Hence, there is sufficient evidence to conclude that there is a difference in the proportion of concussion with respect to three groups.
b.
Interpret the given results.
Answer to Problem 47SE
There is no sufficient evidence to conclude that there exists a negative correlation or association in the population at 1% level of significance.
Explanation of Solution
Given info:
The sample correlation coefficient for the soccer players group is calculated by using the soccer exposure x and the score on an immediate memory recall test y and it is –0.220.
Calculation:
Testing the significance of correlation:
Null hypothesis:
That is, there is no correlation between x and y.
Alternative hypothesis:
That is, there is a negative correlation between x and y.
Test statistic:
Where,
r represents the correlation coefficient value.
n represents the total sample size.
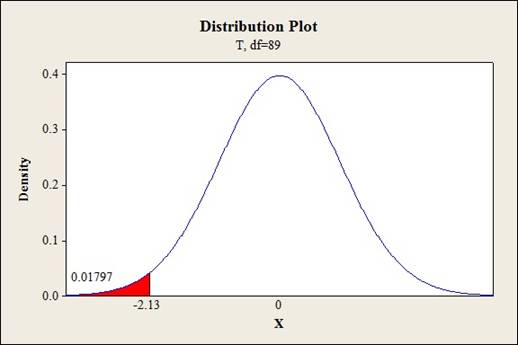
Substitute r as –0.220 and n as 91.
Thus, the test statistic is –2.13.
P-value:
Software procedure:
Step-by-step procedure to obtain the P-value is given below:
- Click on Graph, select View Probability and click OK.
- Select t, enter 89 in degrees of freedom..
- Under Shaded Area Tab select X value under Define Shaded Area By and select left tail.
- Choose X value as –2.13.
- Click OK.
Output obtained from MINITAB is given below:
Conclusion:
The P-valueis 0.018 and the level of significance is 0.01.
The P-valueis lesser than the level of significance.
That is,
Thus, the null hypothesis is not rejected.
Hence, there is no sufficient evidence to conclude that there exists a negative correlation or association in the population at 1% level of significance.
c.
Analyze the given data and draw conclusions.
Answer to Problem 47SE
There is sufficient evidence to conclude that the average scores of two groups are the same.
Explanation of Solution
Given info:
An oral test was conducted for soccer and non-soccer athletes. The summary statistics are given below:
Calculation:
Testing the hypothesis:
Null hypothesis:
That is, the average test score is same for the two groups.
Alternative hypothesis:
That is, the average test score is not the same for the two groups.
Test statistic:
Software procedure:
Step-by-step procedure to obtain the test statistic using MINITAB is given below:
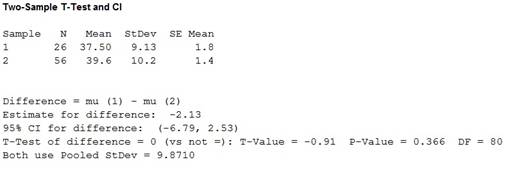
- Choose Stat > Basic Statistics > 2-Sample t.
- Choose Summarized data.
- In first, enter Sample size as 26, Mean as 37.50, Standard deviation as 9.13.
- In second, enter Sample size as56, Mean as 39.63, Standard deviation as 10.19.
- Select Assume equal variances.
- Choose Options.
- In Confidence level, enter 95.
- Choose not equal in Alternative.
- Click OK.
Output obtained from MINITAB is given below:
Conclusion:
The P-value is 0.366 and the level of significance is 0.10.
The P-value is greater than the level of significance.
That is,
Thus, the null hypothesis is not rejected.
Hence, there is sufficient evidence to conclude that the average scores of two groups are the same.
d.
Analyze the given data and draw conclusions.
Answer to Problem 47SE
There is sufficient evidence to conclude that there is a difference in the average number of prior non-soccer concussion between the three groups.
Explanation of Solution
Given info:
The mean plus or standard deviation for the three groups with respect to the number of prior non-soccer concussions are
Calculation:
Testing the hypothesis:
Null hypothesis:
That is, there is no difference in the average number of prior non-soccer concussion between the three groups.
Alternative hypothesis:
That is, there is a difference in the average number of prior non-soccer concussion between the three groups.
Test statistic:
Where,
MSE represents the mean sum of squares due to error.
Sum of squares with respect to the three groups is calculated as follows:
Where,
Mean sum of squares due to treatment:
Sum of squares due to error:
Mean sum of squares due to error:
Thus, the F-statistic is calculated as follows:
Critical value:
Software procedure:
Step-by-step procedure to obtain the P-value is given below:
- Click on Graph, select View Probability and click OK.
- Select F, enter 2 in numerator df and 236 in denominator df.
- Under Shaded Area Tab select X value under Define Shaded Area By and select right tail.
- Choose Probability as 0.05.
- Click OK.
Output obtained from MINITAB is given below:
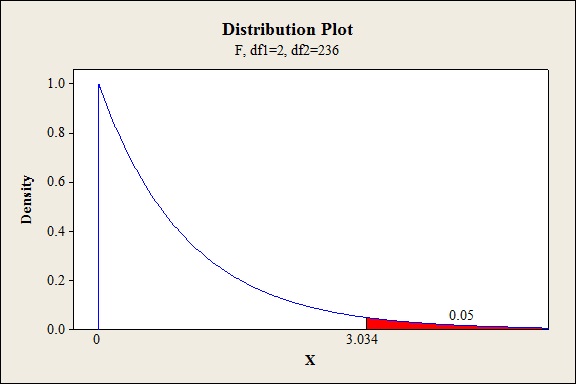
Thus, the critical value is 3.034.
Conclusion:
The test statisticis 3.319and the critical value is 3.034.
The test statisticis lesser than the critical value.
That is,
Thus, the null hypothesis is rejected.
Hence, there is sufficient evidence to conclude that there is a difference in the average number of prior non-soccer concussion between the three groups.
Want to see more full solutions like this?
Chapter 14 Solutions
Probability and Statistics for Engineering and the Sciences


- Your research team reads the article that is summarized in Question 2. Your team argues that the research design is flawed and that all participants should have been exposed to both conditions in order to observe a true difference. Your team carries out a similar study, yielding the data below. Participant ID No VR Condition VR Condition _______ 001 21 20 002 23 23 003 19 17 004 22 23 005 24 20 006 22 19 007 23 20 008 23 17 009 21 19 010 20 17 011 22 20 012 19 20 013 18 21 014 23 18 015 21 17 016 20 19 017 19 20 018 24 18 019 25 20 020 22 22 a.) What sort of research design is used in this study? How do you know? b.) What values go in the last column? Write the (very simple) formula used to calculate the last column below and then go…arrow_forwardThe data below are stress-test scores from 6 nurses from the Emergency Care (EC) unit and 6 nurses from the Long Term (LT) care unit who were randomly selected for the study. The investigator wants to test, at the 5% level, whether there is a difference in stress test scores in the EC group and the LT group. EC LT 5 2 9 3 8 5 10 6 7 4 6 2 State the hypotheses. What statistical test should be used to determine if there is a difference in stress scores between EC and LT nurses? Determine the appropriate critical value and set up the decision rule. Compute the test statistic. Interpret your results. Give your conclusion.arrow_forwardThe National Sleep Foundation conducted a survey on the sleep habits of randomly sampled transportation workers and a control sample of non-transportation workers. The results of the survey are shown below. Control Pilots Truck Drivers Train Operators Bus/Taxi/Limo Drivers Less than 6 hours of sleep 35 19 35 29 21 6 to 8 hours of sleep 193 132 117 119 131 More than 8 hours 64 51 51 32 58 Total 292 202 203 180 210 Conduct a hypothesis test to evaluate if these data provide evidence of a difference between the proportions of truck drivers and non-transportation workers (the control group) who get less than 6 hours of sleep per day, i.e. are considered sleep deprived.arrow_forward
- Reviewers from the Oregon Evidence-Based Practice Center at the Oregon Health and Science University investigated the effectiveness of prescription drugs in assisting people to fall asleep and stay asleep (source: S. Carson, M.S. McDonagh, et al., “Drug class review: Newer drugs for insomnia,” Oregon Health and Science University, 2008, http://www.ncbi.nlm.nih.gov). Suppose a study of two drugs, Sonata and Ambien, was conducted and the resulting data are contained in a file titled Shuteye. The samples reflect an experiment in which individuals were randomly given the two brands of pills on separate evenings. Their time spent sleeping was recorded for each of the brands of sleeping pills. (A) Does the experiment seem to have dependent or independent samples? Explain your reasoning. (B) Do the data indicate that there is a statistical difference in the mean time spent sleeping for people using the two drugs? Test using alpha = 0.02. Conduct a statistical procedure to determine this. (C)…arrow_forwardA psychologist was interested in the effects of time of day on critical thinking. Participants were randomly assigned to one of three groups (Morning, Afternoon, or Night) and given a measure to test for the number of answers correct on a critical thinking ability test. The following data were obtained from the study. Morning Afternoon Night 4 3 8 3 1 4 5 3 6 4 1 6 What would be the reasonable alternative hypothesis for this study?arrow_forwardA cross-sectional study is conducted to investigate cardiovascular disease (CVD) risk factors among a sample of patients seeking medical care at one of three local hospitals. A total of 500500 patients are enrolled. Based on the following data, we would like to determine if there is a significant association between the family history of CVD and the enrollment site. Enrollment Site Family History of CVD Hospital 1 Hospital 2 Hospital 3 Total Yes 34 8 58 100 No 104 72 224 400 Total 138 80 282 500 Given: The value of the test statistic is χ2= 6.912 Use α=0.1 as the level of significance. The superintendent of Hospital 2 performed the Goodness of Fit Test to test whether 25% of the patients go to Hospital 1, 15% of the patients go to Hospital 2 and 60% of the patients go to Hospital 3. Given: The superintendent found that the pp-value for the test is 0.25091 Let: p1=p1= be the proportion of patients at Hospital 1 p2=p2= be the proportion of patients at…arrow_forward
- The following data are obtained from a study that seeks to investigate theeffects of an intervention program and the extent of their physical disability on their reading, math and IQ scores. The students who had been recipients of an intervention program are in the treatment group and while those who are not are in the control group. Questions:1. Is there a significant difference in the math, reading and IQ scores ofstudents in the treatment and controlgroups?2. Is the intervention program effective?3. Is there a significant difference in the math, reading and IQ scores ofstudentswhen they are grouped according to the extent of their physicaldisability?4. Isthereasignificantinteractionbetweentreatmentandextentofdisabilityonthe students’ reading, math and IQscores?arrow_forwardIn a study of whether taking a garlic supplement reduces the risk of getting a cold, participants were assigned to either a garlic supplement group or to a group that did not take a garlic supplement.† Based on the study, it was concluded that the proportion of people taking a garlic supplement who get a cold is lower than the proportion of those not taking a garlic supplement who get a cold. Do you think that the study was conducted in a reasonable way? What additional information would you want in order to evaluate this study? (Select all that apply.) A) whether the patients knew which treatment they were receiving B) whether the patients were randomly assigned to the treatments C) whether the patient's last name started with A through M D) whether the patient's cold lasted more than a week E) whether the experiment was conducted on a sufficient number of patients so that the differences observed could not be attributed to chancearrow_forwardIn a study designed to test the effectiveness of hypnosis in reducing pain a research team looked at responses from 8 randomly selected patients before and after hypnosis. The raw data are found in Table 1. Let ? = 0.01 Table 1: Perceived pain levels pre and post hypnosis for 8 subjects Pre 9.6 11.3 10.6 8.5 9.8 12.8 10.8 12.2 Post 9.3 11.0 8.5 10.0 10.2 9.4 8.9 11.5 Diff -0.3 -0.3 -2.1 1.5 0.4 -3.4 -1.9 -0.7 E) The point estimate for the true standard deviation of the effect that hypnosis has on pain perception is: Note: round your answer to 3 decimal precision G) The test statistic for this data set is: Note: Round your answer to the nearest hundredth.arrow_forward
- A study in Sweden looked at former elite soccer players, people who had played soccer but not at the elite level, and people of the same age who did not play soccer. Here is a two-way table that classifies these subjects by whether or not they had arthritis of the hip or knee by their mid-fifties: Elite Non-elite Did not play Arthritis 10 9 24 No arthritis 61 206 548 Based on this study, you can conclude thatarrow_forwardIn studies examining the effect of humor on interpersonal attractions, McGee and Shevlin (2009) found that an individual’s sense of humor had a significant effect on how the individual was perceived by others. In one part of the study, female college students were given brief descriptions of a potential romantic partner. The fictitious male was described positively as being single and ambitious and having good job prospects. For one group of participants, the description also said that he had a great sense of humor. For another group, it said that he has no sense of humor. After reading the description, each participant was asked to rate the attractiveness of the man on a seven-point scale from 1 (very unattractive) to 7 (very attractive). A score of 4 indicates a neutral rating. The females who read the “great sense of humor” description gave the potential partner an average attractiveness score of M = 4.53 with a standard deviation of s = 1.04. If the sample consisted of n = 16…arrow_forwardThe authors of a research article were interested in the effect on female viewers of watching movies in which female heroines were portrayed in roles that focus on their sex appeal. They carried out an experiment in which female college students were assigned at random to one of two experimental groups. The 24 women in one group watched 13 minutes of scenes from a certain superhero film series and then responded to a questionnaire designed to measure body esteem. Lower scores on this measure correspond to lower body satisfaction. The 29 women in the other group (the control group) did not watch any video prior to responding to the questionnaire measuring body esteem. For the women who watched the video, the mean body esteem score was 4.44 and the standard deviation was 1.02. For the women in the control group, the mean body esteem score was 5.07 and the standard deviation was 0.96. For purposes of this exercise, you may assume that the distribution of body esteem scores for each of the…arrow_forward
 Holt Mcdougal Larson Pre-algebra: Student Edition...AlgebraISBN:9780547587776Author:HOLT MCDOUGALPublisher:HOLT MCDOUGAL