Subpart (a):
Profit maximization.
Subpart (a):
Explanation of Solution
Table – 1 represents the value of quantity, total cost, and total revenue.
Table – 1
| Quantity | Total cost | Total revenue |
| 0 | 8 | 0 |
| 1 | 9 | 8 |
| 2 | 10 | 16 |
| 3 | 11 | 24 |
| 4 | 13 | 32 |
| 5 | 19 | 40 |
| 6 | 27 | 48 |
| 7 | 37 | 56 |
The profit can be calculated by using the following formula:
Substitute the respective value in equation (1) and calculate the profit.
The profit is –$8.
Table – 2 shows the value of the profit that is obtained, by using equation (1).
Table – 2
| Quantity | Total cost | Total revenue | Profit |
| 0 | 8 | 0 | –8 |
| 1 | 9 | 8 | –1 |
| 2 | 10 | 16 | 6 |
| 3 | 11 | 24 | 13 |
| 4 | 13 | 32 | 19 |
| 5 | 19 | 40 | 21 |
| 6 | 27 | 48 | 21 |
| 7 | 37 | 56 | 19 |
From the above table, the firm can maximize profit when they produce five or six units of output.
Concept introduction:
Perfect competitive firm:
Marginal Revenue (MR): Marginal revenue refers to the additional revenue earned due to increasing one more unit of output.
Marginal Cost (MC): The marginal cost refers to the amount of an additional cost incurred in the process of increasing one more unit of output.
Subpart (b):
Profit maximization.
Subpart (b):
Explanation of Solution
The marginal revenue can be calculated by using the following formula:
Substitute the respective value in equation (2) and calculate marginal revenue.
The marginal revenue is $8.
Table – 3 shows the value of the marginal revenue that obtained by using equation (2).
Table – 3
| Quantity | Total cost | Total revenue | Marginal revenue | Profit |
| 0 | 8 | 0 | – | –8 |
| 1 | 9 | 8 | 8 | –1 |
| 2 | 10 | 16 | 8 | 6 |
| 3 | 11 | 24 | 8 | 13 |
| 4 | 13 | 32 | 8 | 19 |
| 5 | 19 | 40 | 8 | 21 |
| 6 | 27 | 48 | 8 | 21 |
| 7 | 37 | 56 | 8 | 19 |
The marginal cost can be calculated by using the following formula:
Substitute the respective value in equation (3) and calculate the marginal cost.
The marginal cost is $8.
Table – 4 shows the value of the marginal cost that is obtained by using equation (3).
Table – 4
| Quantity | Total cost | Marginal cost | Total revenue | Marginal revenue | Profit |
| 0 | 8 | – | 0 | – | –8 |
| 1 | 9 | 1 | 8 | 8 | –1 |
| 2 | 10 | 1 | 16 | 8 | 6 |
| 3 | 11 | 1 | 24 | 8 | 13 |
| 4 | 13 | 2 | 32 | 8 | 19 |
| 5 | 19 | 6 | 40 | 8 | 21 |
| 6 | 27 | 8 | 48 | 8 | 21 |
| 7 | 37 | 10 | 56 | 8 | 19 |
Figure – 1 shows the marginal revenue curve and marginal cost curve.
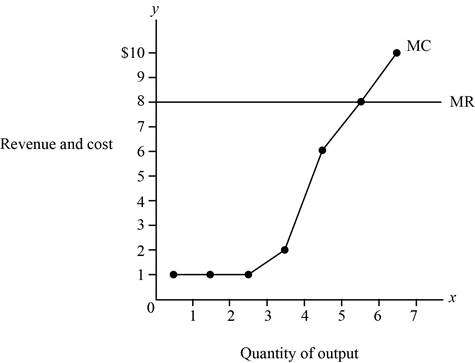
Figure – 1
From the above figure, the x axis shows the quantity of output and the y axis shows the price, that is, revenue and cost. From the above figure, the intersecting point shows the point the firm’s maximizing profit when they produce five or six units of output.
Concept introduction:
Perfect competitive firm: Perfect competition refers to the market structure featuring more number of sellers and buyers in the market, where the firm can sell homogenous products.
Marginal Revenue (MR): Marginal revenue refers to the additional revenue earned due to increasing one more unit of output.
Marginal Cost (MC): The marginal cost refers to the amount of an additional cost incurred in the process of increasing one more unit of output.
Subpart (c):
Profit in the long run.
Subpart (c):
Explanation of Solution
Since the marginal revenue is the same as each level of the quantity, the firm is in a competitive industry. The firm is earning an economic profit. Generally, firms in the long run earn a normal profit. Thus, the firm is not in the long run equilibrium.
Concept introduction:
Long run: Thelong run refers to the time, which changes the production variable to adjust to the market situation.
Want to see more full solutions like this?
Chapter 14 Solutions
Principles of Microeconomics

- Which of the following statements is (are) correct? (x) In the short run, if a firm produces nothing, then, by definition, fixed costs will equal zero. (y) Fixed costs can be defined as costs that are incurred even if nothing is produced. (z) Although fixed costs do not vary as a firm varies the output amount that it produces, average fixed costs for the firm do vary as the amount of output varies. (x), (y) and (z) (x) and (y) only (x) and (z) only (y) and (z) only (z) onlyarrow_forwardTotal revenue for producing 10 units of output is $5. Total revenue for producing 11 units of output is $9. Given this information, the Average revenue for producing 11 units is $2. Average revenue for producing 11 units is $4 Marginal revenue for producing the 11th unit is $2. Marginal revenue for producing the 11th unit is $4.arrow_forwardCosts in the short run versus in the long run Ike's Bikes is a major manufacturer of bicycles. Currently, the company produces bikes using only one factory. However, it is considering expanding production to two or even three factories. The following table shows the company's short-run average total cost each month for various levels of production if it uses one, two, or three factories. (Note: QQ equals the total quantity of bikes produced by all factories.) Number of Factories Average Total Cost (Dollars per bike) QQ = 100 QQ = 200 QQ = 300 QQ = 400 QQ = 500 QQ = 600 1 440 320 240 320 480 720 2 580 400 240 240 400 580 3 720 480 320 240 320 440 Suppose Ike’s Bikes is currently producing 600 bikes per month in its only factory. Its short-run average total cost is Blank per bike. Suppose Ike’s Bikes is expecting to produce 600 bikes per month for several years. In this case, in the long run, it would choose to produce bikes usingthree…arrow_forward
- The diagram displays short-run cost curves for a facility that produces liquid crystal display (LCD) screens for cell phones: a) What are the daily total fixed costs of producing LCD screens?b) What are the total variable costs of producing 100 LCD screens per day?c) What are the total costs of producing 100 LCD screens per day?d) What is the marginal cost of producing 100 LCD screens instead of 99? (Hint: To answer this question, you must first determine the total costs-or, alternatively, the total variable costs of producing 99 LCD screens.)arrow_forwardQuestion (3): Consider the firm whose goal is to maximize profits and there is competition in the marketplace. The firm’s total revenue and cost functions are displayed below. R(q)=q2+14q+20 C(q)=2q2-8q+15 What is the firm’s total fixed cost function, and total fixed costs of production? How many units must the firm manufacture to minimize its total costs of production? (For this question give me detailed, not too much, answer )arrow_forwardTHIS EXERCISE FOR MATHEMATICAL ECONOMIC : Question (4): Consider a firm, where there is competition, looking to maximize its profits and the market has determined that the equilibrium price, the price firms must charge consumers is $45 a unit. The firm has determined that to minimize its total cost of production, it must produce 3 (in millions) units of good x. The firm’s total cost function is: C(q)= q3+2q2+11q+2 How much will the firm earn in total sales (revenues)? How much will the firm incur in total costs? What will be the firm’s total variable cost of production? What will be the firm’s total profits? What will be the average cost of production per unit of good x and what will be the average revenue per unit earned? Suppose that the market has repriced good x (per unit) to $38 and the firm will adjust its output to minimize its total cost of production to 2 (in millions).Can the firm continue to operate under this environment? Explain how you come to your conclusion.arrow_forward
- 3. Consider the table below of long-run total costs for three different firms: Does each of these firms experience economies of scale or diseconomies of scale?Explain your answer!arrow_forwardShowing your analytical work clearly in a step by step manner is a must. Otherwise points will be deducted. You can use Excel or any other graphing tool. A startup software company has indicated its cost, c(x), and revenue, f(x), as given below, such that x is the number of lines of programing code (units in 1000 lines). c(x) = 80000 - 2(x-200)2 f(x) = (x-10)3 + (x+10)2 Find the marginal cost analytically, and draw its graph Find the marginal revenue analytically, and draw its graph Solve for the x point where marginal cost is equal to marginal revenue analytically. Comment why is this point significant analytically. Write the profit function and draw its graph Is the profit function concave up or concave down? Answer all questions neatly pleasearrow_forwardExplain the concept of total revenue and total costarrow_forward
- Indicate how each of the following would shift the (1) marginal- cost curve, (2) average-variable-cost curve, (3) average- fixed-cost curve, and (4) average-total-cost curve of a manufacturing firm. In each case, specify the direction of the shift. A decrease in the price of electricity.arrow_forwardConsider the business whose Total Cost and Total Revenue for various quantities of a particular product are shown in the table below. Quantity Total Cost Total Revenue 0 100 0 1 250 500 2 350 950 3 500 1350 4 725 1700 5 1000 2000 6 1400 2250 Use the Profit-Maximizing Rule to explain the quantity that this business should produce to maximize its profits. Answer must both state the number to produce and an explanation of how you used the profit-maximizing rule to arrive at that number.arrow_forwardWhich one of the following statements about a firm’s cost curves is true? A. The average variable cost curve only includes explicit costs. B. Increases in input prices for variable factors of production will shift the firm’s marginal cost curve up and also shift the firm’s total variable cost curve up. C. Fixed costs only include implicit costs. D. An increase in the price of a fixed factor of production will shift all of the firm’s cost curves up. E. A competitive firm’s short run supply curve is always identical at all points to its short run marginal cost curve.arrow_forward
 Essentials of Economics (MindTap Course List)EconomicsISBN:9781337091992Author:N. Gregory MankiwPublisher:Cengage Learning
