
Concept explainers
Videos
Machine Maintenance. Jensen Tire & Auto is in the process of deciding whether to purchase a maintenance contract for its new computer wheel alignment and balancing machine. Managers feel that maintenance expense should be related to usage, and they collected the following information on weekly usage (hours) and annual maintenance expense (in hundreds of dollars).
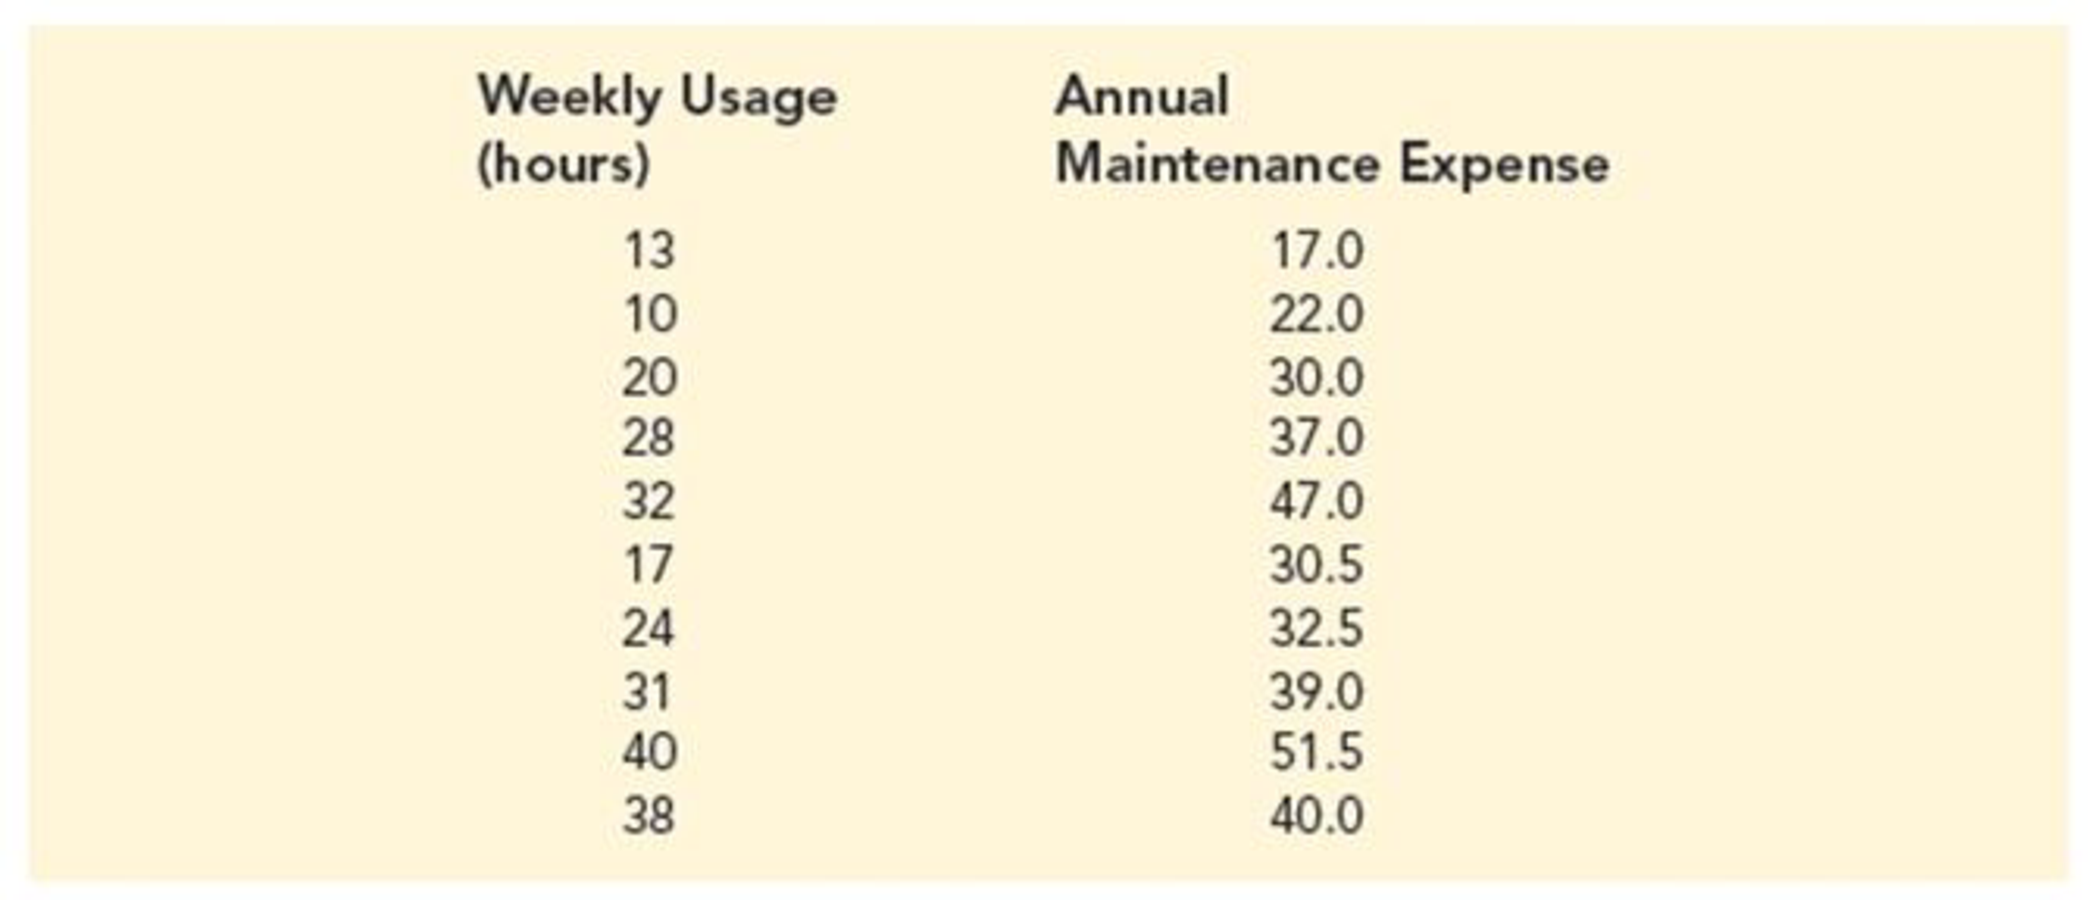
- a. Develop the estimated regression equation that relates annual maintenance expense to weekly usage.
- b. Test the significance of the relationship in part (a) at a .05 level of significance.
- c. Jensen expects to use the new machine 30 hours per week. Develop a 95% prediction interval for the company’s annual maintenance expense.
- d. If the maintenance contract costs $3000 per year, would you recommend purchasing it? Why or why not?
a.
Find the estimated regression equation that relates annual maintenance expense to weekly usage.
Answer to Problem 58SE
The estimated regression equation is
Explanation of Solution
Calculation:
The data related to the weekly usage (hours) and Annual Maintenance Expense (in hundreds of dollars) to purchase a maintenance contract for new computer wheel alignment and balancing machine.
Regression:
Software procedure:
Step-by-step procedure to obtain the estimated regression equation using Excel:
- In Excel sheet, enter Size and Selling Price in different columns.
- In Data, select Data Analysis and choose Regression.
- In Input Y Range, select Expense.
- In Input X Range, select Usage.
- Select Labels.
- Click OK.
Output obtained using Excel is given below:
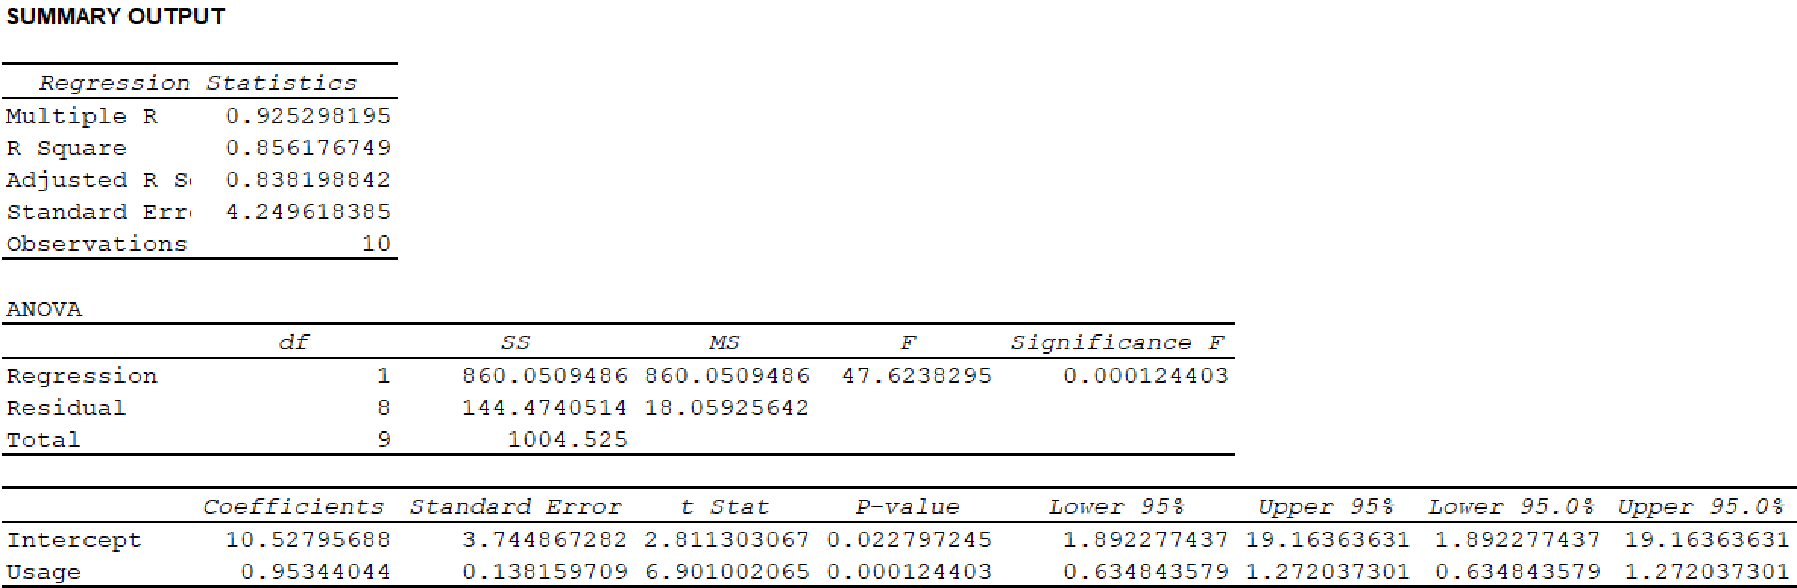
Thus, the estimated regression equation is
b.
Test for a significant relationship at
Answer to Problem 58SE
There is a significant relationship between annual maintenance expense and weekly usage.
Explanation of Solution
Calculation:
State the test hypotheses.
Null hypothesis:
That is, there is no significant relationship between expense and usage.
Alternative hypothesis:
That is, there is a significant relationship between expense and usage.
From the output in Part (a) it is found that the F-test statistic is 47.62.
Level of significance:
The given level of significance is
p-value:
From the output in pat (a) it is found that the p-value is 0.00.
Rejection rule:
If the
Conclusion:
Here, the p-value is less than the level of significance.
That is,
Thus, the decision is “reject the null hypothesis”.
Therefore, the data provide sufficient evidence to conclude that there is a significant relationship between expense and usage.
Thus, annual maintenance expense and weekly usage are related.
c.
Find a 95% prediction interval for the company’s annual maintenance expense.
Answer to Problem 58SE
The 95% prediction interval for the company’s annual maintenance expense is
Explanation of Solution
Calculation:
For a sample of size n, the degrees of freedom is given as
In this given problem, for sample of size 10, the degrees of freedom is as follows:
Thus, the degrees of freedom is 8.
Level of significance:
The given level of significance is
For two-tails distribution, the value is as follows:
Form the table 2 of “t Distribution” in Appendix B, it is found that the value of t test statistic with level of significance 0.025 and degrees of freedom 8 is
According to the regression equation
Thus, the possible value of dependent variable y when
The estimate of standard deviation corresponding to the prediction of the value of
It is known for a sample size n that mean of a random variable x can be obtained as follows:
Thus, mean of the random variable x is given below:
The value of
| 13 | 151.29 |
| 10 | 234.09 |
| 20 | 28.09 |
| 28 | 7.29 |
| 32 | 44.89 |
| 17 | 68.89 |
| 24 | 1.69 |
| 31 | 32.49 |
| 40 | 216.09 |
| 38 | 161.29 |
| Total | 946.1 |
Here, it is found that,
From the output, the value of given MSE for sample of size 10 is
The standard error of the estimate is obtained as follows:
Thus, the standard error of the estimate is 4.2496.
It is also found that for
For
Thus, the standard deviation of an individual value of y for
The prediction interval for expected value of
Therefore, the required prediction interval is given below:
Thus, the 95% prediction interval for the company’s annual maintenance expense is
d.
Explain whether it is recommended purchase a machine of the maintenance costs of $3,000 per year.
Explanation of Solution
Calculation:
The estimated regression equation is
Substitute 30 for usage in estimated regression equation.
In this case, the expected expense is 39.12 or $3,912. Therefore, it is recommended purchase a machine of the maintenance costs of $3,000 per year.
Want to see more full solutions like this?
Chapter 14 Solutions
Modern Business Statistics with Microsoft Office Excel (with XLSTAT Education Edition Printed Access Card) (MindTap Course List)


- Find the equation of the regression line for the following data set. x 1 2 3 y 0 3 4arrow_forwardOlympic Pole Vault The graph in Figure 7 indicates that in recent years the winning Olympic men’s pole vault height has fallen below the value predicted by the regression line in Example 2. This might have occurred because when the pole vault was a new event there was much room for improvement in vaulters’ performances, whereas now even the best training can produce only incremental advances. Let’s see whether concentrating on more recent results gives a better predictor of future records. (a) Use the data in Table 2 (page 176) to complete the table of winning pole vault heights shown in the margin. (Note that we are using x=0 to correspond to the year 1972, where this restricted data set begins.) (b) Find the regression line for the data in part ‚(a). (c) Plot the data and the regression line on the same axes. Does the regression line seem to provide a good model for the data? (d) What does the regression line predict as the winning pole vault height for the 2012 Olympics? Compare this predicted value to the actual 2012 winning height of 5.97 m, as described on page 177. Has this new regression line provided a better prediction than the line in Example 2?arrow_forwardThe following fictitious table shows kryptonite price, in dollar per gram, t years after 2006. t= Years since 2006 0 1 2 3 4 5 6 7 8 9 10 K= Price 56 51 50 55 58 52 45 43 44 48 51 Make a quartic model of these data. Round the regression parameters to two decimal places.arrow_forward
- A shoe store developed the following estimated regression equation relating sales to inventory investment and advertising expenditures. ŷ = 25 + 10x1 + 8x2 where x1 = inventory investment ($1,000s) x2 = advertising expenditures ($1,000s) y = sales ($1,000s). (a) Predict the sales (in dollars) resulting from a $15,000 investment in inventory and an advertising budget of $11,000. $ ----------------- (b) Interpret b1 and b2 in this estimated regression equation. Sales can be expected to increase by $ ---------------for every dollar increase in inventory investment when advertising expenditure is held constant. Sales can be expected to increase by $-----------------for every dollar increase in advertising expenditure when inventory investment is held constant.arrow_forwardThe operations manager of a musical instrument distributor feels that the demand for Bass Drums may be related to the number of television appearances by the popular rick group Green Shades during the previous month. The manager has collected the data shown in the following table. Demand for Bass Drums 3 6 7 5 10 8 Green Shades TV appearances 3 4 7 6 8 5 Develop the linear regression equation to forecast. Forecast demand for Bass Drums when Green Shades’ TV appearances are 10. Compute MSE and standard deviation for Problem 8.arrow_forward1. The following data give the percentage of women working in five companies in the retail and trade industry. The percentage of management jobs held by women in each company is also shown. % Working 69 48 73 54 61 % Management 51 21 61 51 43 Develop the estimated regression equation by computing the values of b0 (y-intercept) and b1 (slope).Predict the percentage of management jobs held by women in a company that has 65% women employees.arrow_forward
- A real estate agency collects data concerning the sales of a house (in thousands of dollars) and the home size (in hundreds of square feet). The data are given in the table below. Sales Price (Y, $1,000) Home Size (X, 100 sf)______ 180 23 98.1 11 173.1 20 136.5 17 141 15 165.9 21 193.5 24 127.8 13…arrow_forwardThe director of marketing at Vanguard Corporation believes that sales of the company's Bright Side laundry detergent (S) are related to Vanguard's own advertising expenditure (A), as well as the combined advertising expenditures of its three biggest rival detergent (R). The marketing director collects 36 weekly observations on S, A and R to estimate the following multiple regression equation: S = a + bA + cR .where, S, A, and R are measured in dollars per week. Vanguard's marketing director is comfortable using parameter estimates that are statistically significant at the 10% level or better.DEPENDENT VARIABLE: S R-SQUARE F-RATIO P-VALUE ON FOBSERVATIONS: 36 0.2247 4.781 0.0150VARIABLE PARAMETER STANDARD T-RATIO P-VALUE ESTIMATE ERRORINTERCEPT 175086.0 63821.0 2.74 0.0098A 0.8550 0.3250…arrow_forwardThe following data relate the sales figures of the bar in Mark kaltenbach's small bed-and-breakfast inn in Portland, to the number of guests registered that week: Week Guest Bar sales 1 16 $330 2 12 $270 3 18 $380 4 14 $315 a) The simple linear regression equation that relates bar sales to number of guests (not to time) is ( round your response to one decimal place) Bar sales= ___+___Xguestsarrow_forward
- The following data set shows the entrance exam score (Verbal GMAT) for each of eight MBA students along with his or her grade point average (GPA) upon graduation. Calculate the slope and y-intercept for the linear regression equation for these data. GMAT 320 290 250 290 340 270 290 290 GPA 3.7 3.1 3.1 3.1 3.8 2.9 3.6 2.9arrow_forwardTwenty members of an athletic club are studying the relationship between the time it takes an individual athlete to reach a given level of fatigue during exercise (time to fatigue, measured in minutes) and athletic performance. For each member, time to fatigue and a performance score were recorded. The computer output of the regression analysis is shown in the table. Term CoefCoef SE CoefSE Coef TT Constant 39.88 4.24 9.41 Time to fatigue 3.92 0.71 5.52 Which of the following is a 90 percent confidence interval for the slope of the regression line relating performance score and time to fatigue? Assume that the conditions for inference are met.arrow_forwardArmer Company is accumulating data to use in preparing its annual profit plan for the coming year. The cost behavior pattern of the maintenance costs must be determined. The accounting staff has suggested the use of linear regression to derive an equation for maintenance hours and costs. Data regarding the maintenance hours and costs for the last year and the results of the regression analysis follow: Month Maintenance Cost Machine Hours Jan. $ 5,050 820 Feb. 3,850 660 Mar. 4,450 740 Apr. 3,670 640 May 5,200 840 June 3,810 650 July 3,880 660 Aug. 5,320 940 Sept. 5,110 830 Oct. 4,900 810 Nov. 4,150 690 Dec. 4,010 680 Sum $ 53,400 8,960 Average $ 4,450 $ 747 Average cost per hour $ 6.00 a (intercept) $ 194.33 b (coefficient) 6.2201 Standard error of the estimate 144.247 R-squared 0.9517 t-value for b 14.030…arrow_forward
 College AlgebraAlgebraISBN:9781305115545Author:James Stewart, Lothar Redlin, Saleem WatsonPublisher:Cengage Learning
 Algebra and Trigonometry (MindTap Course List)AlgebraISBN:9781305071742Author:James Stewart, Lothar Redlin, Saleem WatsonPublisher:Cengage Learning
 Functions and Change: A Modeling Approach to Coll...AlgebraISBN:9781337111348Author:Bruce Crauder, Benny Evans, Alan NoellPublisher:Cengage Learning