
Concept explainers
Videos
Market Beta. Market betas for individual stocks are determined by simple linear regression. For each stock, the dependent variable is its quarterly percentage return (capital appreciation plus dividends) minus the percentage return that could be obtained from a risk-free investment (the Treasury Bill rate is used as the risk-free rate). The independent variable is the quarterly percentage return (capital appreciation plus dividends) for the stock market (S&P 500) minus the percentage return from a risk-free investment. An estimated regression equation is developed with quarterly data; the market beta for the stock is the slope of the estimated regression equation (b1). The value of the market beta is often interpreted as a measure of the risk associated with the stock. Market betas greater than 1 indicate that the stock is more volatile than the market average; market betas less than 1 indicate that the stock is less volatile than the market average. Suppose that the following figures are the differences between the percentage return and the risk-free return for 10 quarters for the S&P 500 and Horizon Technology.
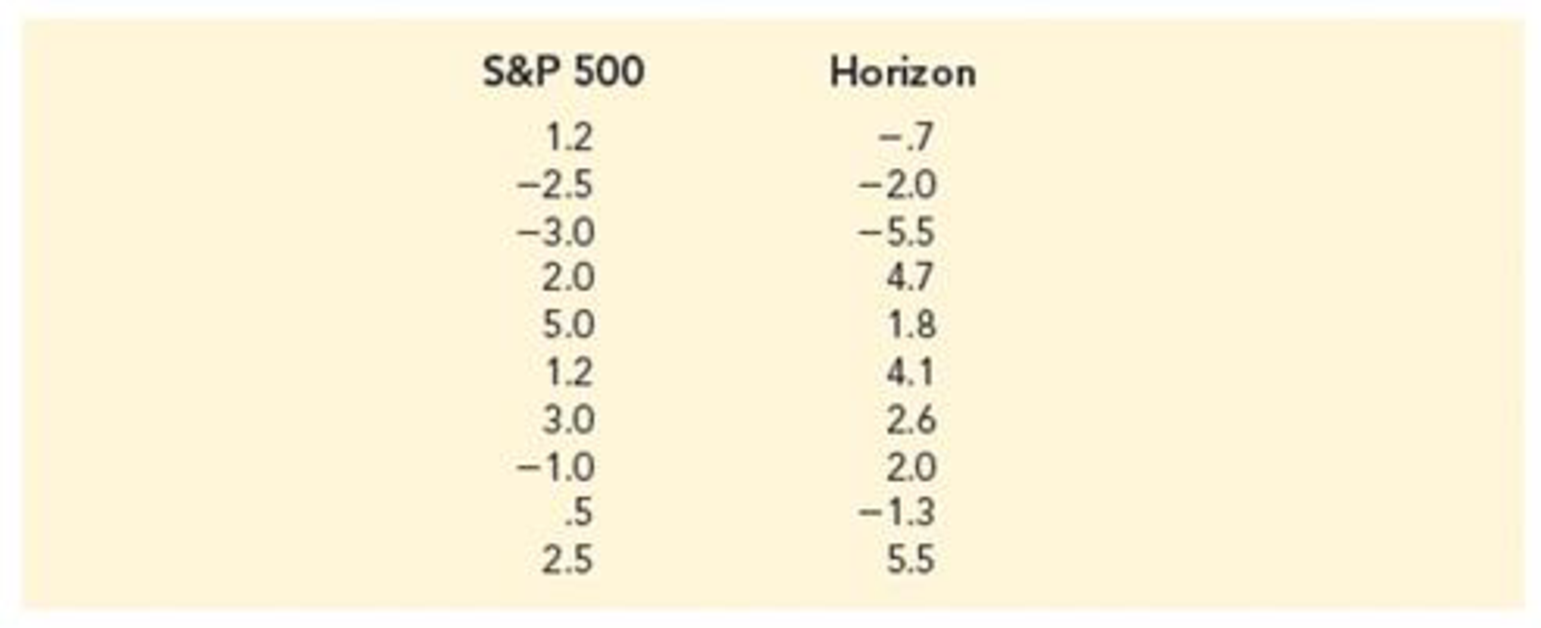
- a. Develop an estimated regression equation that can be used to predict the market beta for Horizon Technology. What is Horizon Technology’s market beta?
- b. Test for a significant relationship at the .05 level of significance.
- c. Did the estimated regression equation provide a good fit? Explain.

Trending nowThis is a popular solution!

Chapter 14 Solutions
Essentials Of Statistics For Business & Economics


- XYZ Corporation Stock Prices The following table shows the average stock price, in dollars, of XYZ Corporation in the given month. Month Stock price January 2011 43.71 February 2011 44.22 March 2011 44.44 April 2011 45.17 May 2011 45.97 a. Find the equation of the regression line. Round the regression coefficients to three decimal places. b. Plot the data points and the regression line. c. Explain in practical terms the meaning of the slope of the regression line. d. Based on the trend of the regression line, what do you predict the stock price to be in January 2012? January 2013?arrow_forwardDemand for Candy Bars In this problem you will determine a linear demand equation that describes the demand for candy bars in your class. Survey your classmates to determine what price they would be willing to pay for a candy bar. Your survey form might look like the sample to the left. a Make a table of the number of respondents who answered yes at each price level. b Make a scatter plot of your data. c Find and graph the regression line y=mp+b, which gives the number of respondents y who would buy a candy bar if the price were p cents. This is the demand equation. Why is the slope m negative? d What is the p-intercept of the demand equation? What does this intercept tell you about pricing candy bars? Would you buy a candy bar from the vending machine in the hallway if the price is as indicated. Price Yes or No 50 75 1.00 1.25 1.50 1.75 2.00arrow_forward
 Algebra and Trigonometry (MindTap Course List)AlgebraISBN:9781305071742Author:James Stewart, Lothar Redlin, Saleem WatsonPublisher:Cengage Learning
 Functions and Change: A Modeling Approach to Coll...AlgebraISBN:9781337111348Author:Bruce Crauder, Benny Evans, Alan NoellPublisher:Cengage Learning
 Elementary Linear Algebra (MindTap Course List)AlgebraISBN:9781305658004Author:Ron LarsonPublisher:Cengage Learning
 Linear Algebra: A Modern IntroductionAlgebraISBN:9781285463247Author:David PoolePublisher:Cengage Learning