
College Algebra (MindTap Course List)
12th Edition
ISBN:9781305652231
Author:R. David Gustafson, Jeff Hughes
Publisher:R. David Gustafson, Jeff Hughes
Chapter8: Sequences, Series, And Probability
Section8.CR: Chapter Review
Problem 37E: Find the positive geometric mean between 4 and 64.

Related questions

Question
Outlays for national defense D (in billions of dollars) for 2006 through 2014 are shown in the table, where t is the time in years, with t = 6 corresponding to 2006. (a) Use the regression capabilities of a graphing utility to find a model of the form D = at4 + bt3 + ct2 + dt + e for the data. (b) Use a graphing utility to plot the data and graph the model. (c) For the years shown in the table, when does the model indicate that the outlay for national defense was at a maximum? When was it at a minimum? (d) For the years shown in the table, when does the model indicate that the outlay for national defense was increasing at the greatest rate?
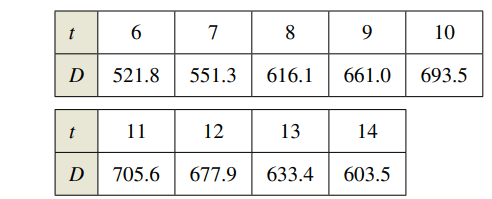
Transcribed Image Text:t
6
7
8
9
10
D
521.8
551.3
616.1
661.0
693.5
t
11
12
13
14
D
705.6 677.9
633.4
603.5
Expert Solution
This question has been solved!
Explore an expertly crafted, step-by-step solution for a thorough understanding of key concepts.

This is a popular solution!

Trending now
This is a popular solution!

Step by step
Solved in 4 steps with 4 images

Knowledge Booster


Learn more about
Need a deep-dive on the concept behind this application? Look no further. Learn more about this topic, calculus and related others by exploring similar questions and additional content below.Recommended textbooks for you
College Algebra (MindTap Course List)
Algebra
ISBN:
9781305652231
Author:
R. David Gustafson, Jeff Hughes
Publisher:
Cengage Learning

Mathematics For Machine Technology
Advanced Math
ISBN:
9781337798310
Author:
Peterson, John.
Publisher:
Cengage Learning,
College Algebra (MindTap Course List)
Algebra
ISBN:
9781305652231
Author:
R. David Gustafson, Jeff Hughes
Publisher:
Cengage Learning
Mathematics For Machine Technology
Advanced Math
ISBN:
9781337798310
Author:
Peterson, John.
Publisher:
Cengage Learning,