
Concept explainers
Videos
The following regression output was obtained from a study of architectural firms. The dependent variable is the total amount of fees in millions of dollars.
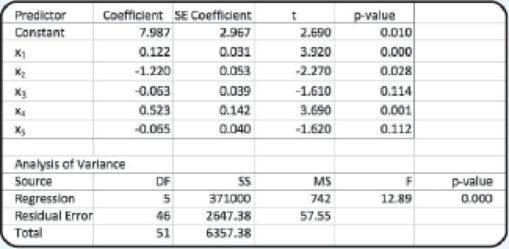
x1 is the number of architects employed by the company.
x2 is the number of engineers employed by the company.
x3 is the number of years involved with health care projects.
x4 is the number of states in which the firm operates.
x5 is the percent of the firm’s work that is health care–related.
- a. Write out the regression equation.
- b. How large is the sample? How many independent variables are there?
- c. Conduct a global test of hypothesis to see if any of the set of regression coefficients could be different from 0. Use the .05 significance level. What is your conclusion?
- d. Conduct a test of hypothesis for each independent variable. Use the .05 significance level. Which variable would you consider eliminating first?
- e. Outline a strategy for deleting independent variables in this case.
a.
Provide the regression equation.
Answer to Problem 8E
The multiple regression equation is,
Explanation of Solution
Calculation:
Multiple linear regression model:
A multiple linear regression model is given as
Here, a is the intercept term of the regression model, that is, the value of predicted value of y when X’s are 0 and
In the given problem, y defines the total amount of fees,
In the given problem, there are five independent variables
Hence, the multiple regression equation is,
b.
Find the sample size and the number of independent variables.
Answer to Problem 8E
The sample size and the number of independent variables are 65 and 2, respectively.
Explanation of Solution
Calculation:
In an ANOVA table the total degrees of freedom is defined as
According to the given question the total degrees of freedom is 51.
That is,
Therefore, the sample size is 52.
In an ANOVA table the degrees of freedom of regression is defined as k, where k is the number of independent variables.
According to the given question, the degrees of freedom for regression is 5. That is,
Hence, the number of independent variables is 5.
c.
Perform a global hypothesis test to check whether any of the set of regression coefficients are different from 0 at 0.05 significance level.
Provide the conclusion.
Answer to Problem 8E
There is strong evidence that not all the regression coefficients are equal to 0 at 0.05 significance level.
Explanation of Solution
Calculation:
Consider that y is dependent variable and
State the hypotheses:
Null hypothesis:
That is, the model is not significant.
Alternative hypothesis:
That is, the model is significant.
In case of global test the F test statistic is defined as,
According to the given ANOVA table the value of F test statistic is 12.89 with numerator degrees of freedom of 5 and denominator degrees of freedom 46.
The level of significance is
Decision rule:
- If
- Otherwise failed to reject the null hypothesis.
Conclusion:
Here, p-value corresponding to the global test is 0.
Hence,
That is, the p-value is less than the level of significance.
Therefore, reject the null hypothesis.
Hence, it can be concluded that not all the regression coefficients are equal to 0 at 0.05 significance level. Thus, there are one or more variables for which the model is not significant.
d.
Perform an individual test of each independent variable at 0.05 significance level.
Find the variable that can be eliminated.
Answer to Problem 8E
There is significant relation between y and
The independent variables
Explanation of Solution
Calculation:
For independent variable
Consider that
State the hypotheses:
Null hypothesis:
That is, there is no significant relationship between y and
Alternative hypothesis:
That is, there is significant relationship between y and
In case of individual regression coefficient test the t test statistic is defined as,
According to the given ANOVA table the value of t test statistic corresponding to
The level of significance is
Conclusion:
Here, p-value corresponding to the
Hence,
That is, the p-value is less than the level of significance.
Therefore, reject the null hypothesis.
Hence, it can be concluded that there is significant relationship between y and
For independent variable
Consider that
State the hypotheses:
Null hypothesis:
That is, there is no significant relationship between y and
Alternative hypothesis:
That is, there is significant relationship between y and
According to the given ANOVA table the value of t test statistic corresponding to
Conclusion:
Here, p-value corresponding to the
Hence,
That is, the p-value is greater than the level of significance.
Therefore, fail to reject the null hypothesis.
Hence, it can be concluded that there is no significant relationship between y and
For independent variable
Consider that
State the hypotheses:
Null hypothesis:
That is, there is no significant relationship between y and
Alternative hypothesis:
That is, there is significant relationship between y and
According to the given ANOVA table the value of t test statistic corresponding to
Conclusion:
Here, p-value corresponding to the
Hence,
That is, the p-value is less than the level of significance.
Therefore, reject the null hypothesis.
Hence, it can be concluded that there is significant relationship between y and
For independent variable
Consider that
State the hypotheses:
Null hypothesis:
That is, there is no significant relationship between y and
Alternative hypothesis:
That is, there is significant relationship between y and
According to the given ANOVA table the value of t test statistic corresponding to
Conclusion:
Here, p-value corresponding to the
Hence,
That is, the p-value is greater than the level of significance.
Therefore, fail to reject the null hypothesis.
Hence, it can be concluded that there is no significant relationship between y and
As there are no significant relationship between the dependent variable and the independent variables
e.
Provide a plan for possibly removing independent variables.
Explanation of Solution
From Part (e), it is found that there are no significant relationship between the dependent variable and the independent variables
Thus, it can be said that the total amount of fees can be predicted well if it can be estimated using only the number of architects, the number of engineers in the company and the number of stated in which the film operate.
Want to see more full solutions like this?
Chapter 14 Solutions
EBK STATISTICAL TECHNIQUES IN BUSINESS


 Functions and Change: A Modeling Approach to Coll...AlgebraISBN:9781337111348Author:Bruce Crauder, Benny Evans, Alan NoellPublisher:Cengage Learning
 Glencoe Algebra 1, Student Edition, 9780079039897...AlgebraISBN:9780079039897Author:CarterPublisher:McGraw Hill
 Big Ideas Math A Bridge To Success Algebra 1: Stu...AlgebraISBN:9781680331141Author:HOUGHTON MIFFLIN HARCOURTPublisher:Houghton Mifflin Harcourt