
EP ELEMENTARY STATISTICS-MYLAB STAT.ACC
13th Edition
ISBN: 9780134464404
Author: Triola
Publisher: PEARSON CO
expand_more
expand_more
format_list_bulleted
Videos
Textbook Question
Chapter 14.1, Problem 11BSC
Quarters. In Exercises 9-12, refer to the accompanying table of weights (grams) of quarters minted by the U.S. government. This table is available for download at www.TriolaStats.com.
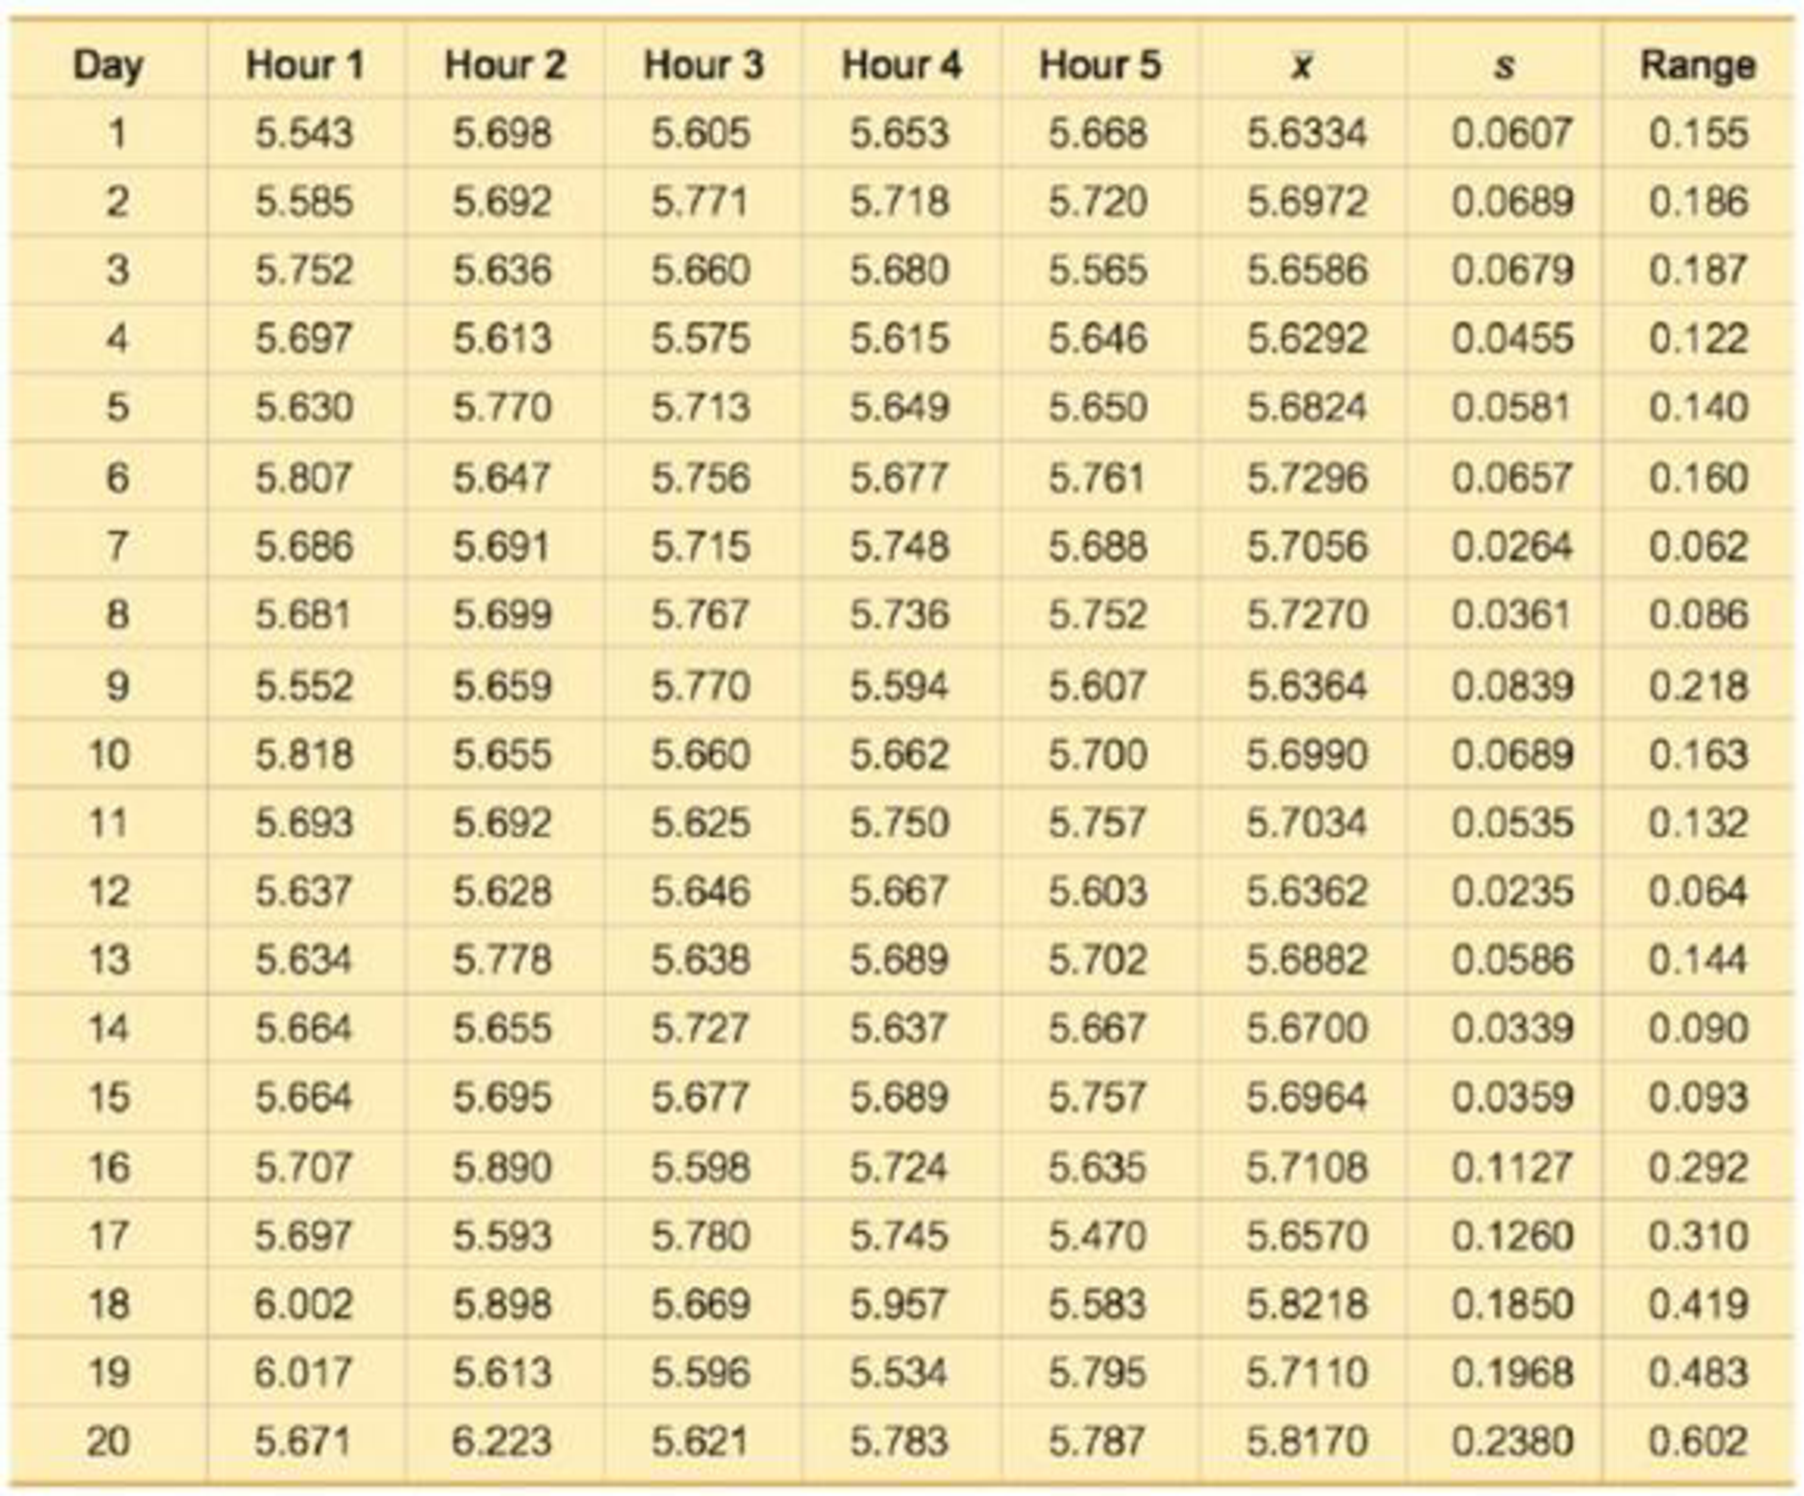
11. Quarters:
Expert Solution & Answer
Want to see the full answer?
Check out a sample textbook solution
Students have asked these similar questions
ANSWER AS SOON AS POSSIBLE. ANSWER EVERYTHING. WILL UPVOTE
Quarters. In Exercises 9-12, refer to the accompanying table of weights (grams) of quarters minted by the U.S. government. This table is available for download at www.TriolaStats.com
Quarters: Run Chart Treat the 100 consecutive measurements from the 20 days as individual values and construct a run chart. What does the result suggest?
Help find the ratio of me. To Women earning bachelor degree
Round to two decimal
Chapter 14 Solutions
EP ELEMENTARY STATISTICS-MYLAB STAT.ACC
Ch. 14.1 - FAA Requirement Table 14-1 on page 655 lists...Ch. 14.1 - Prob. 2BSCCh. 14.1 - Prob. 3BSCCh. 14.1 - Prob. 4BSCCh. 14.1 - Prob. 5BSCCh. 14.1 - Prob. 6BSCCh. 14.1 - Prob. 7BSCCh. 14.1 - Pepsi Cans. In Exercises 5-8, refer to the axial...Ch. 14.1 - Prob. 9BSCCh. 14.1 - Prob. 10BSC
Ch. 14.1 - Quarters. In Exercises 9-12, refer to the...Ch. 14.1 - Prob. 12BSCCh. 14.1 - Prob. 13BBCh. 14.1 - Prob. 14BBCh. 14.2 - Statistical Literacy and Critical Thinking 1....Ch. 14.2 - Prob. 2BSCCh. 14.2 - Control Limits In constructing a control chart for...Ch. 14.2 - Euro Coins After constructing a control chart for...Ch. 14.2 - Control Charts for p. In Exercises 5-12, use the...Ch. 14.2 - Control Charts for p. In Exercises 5-12, use the...Ch. 14.2 - Prob. 7BSCCh. 14.2 - Control Charts for p. In Exercises 5-12, use the...Ch. 14.2 - Control Charts for p. In Exercises 5-12, use the...Ch. 14.2 - Control Charts for p. In Exercises 5-12, use the...Ch. 14.2 - Control Charts for p. In Exercises 5-12, use the...Ch. 14.2 - Control Charts for p. In Exercises 5-12, use the...Ch. 14.2 - Prob. 13BBCh. 14 - What are process data?Ch. 14 - Prob. 2CQQCh. 14 - Prob. 3CQQCh. 14 - Prob. 4CQQCh. 14 - Prob. 5CQQCh. 14 - Prob. 6CQQCh. 14 - Prob. 7CQQCh. 14 - Prob. 8CQQCh. 14 - Prob. 9CQQCh. 14 - Prob. 10CQQCh. 14 - Prob. 1RECh. 14 - Prob. 2RECh. 14 - Prob. 3RECh. 14 - Energy Consumption. Exercises 15 refer to the...Ch. 14 - Prob. 5RECh. 14 - Prob. 1CRECh. 14 - Prob. 2CRECh. 14 - Prob. 3CRECh. 14 - Internet Doctors: Probability Based on the survey...Ch. 14 - Sunspots and the DJIA Listed below are annual...Ch. 14 - Prob. 6CRECh. 14 - Prob. 7CRECh. 14 - Defective Child Restraint Systems The Tracolyte...Ch. 14 - Prob. 9CRECh. 14 - Does It Pay to Plead Guilty? The accompanying...Ch. 14 - FROM DATA TO DECISION Critical Thinking: Are the...
Knowledge Booster


Learn more about
Need a deep-dive on the concept behind this application? Look no further. Learn more about this topic, statistics and related others by exploring similar questions and additional content below.Similar questions
- PLEASE PROVIDE SOLUTION ASAP AND SELECT CORRECT OPTION FOR EACHarrow_forwardApproximate the IQR of this data. O A. 30 OB. 11 OC. 65 O D. 137arrow_forwardFahrenheit is the measurement of temperature commonly used in the US. On the Fahrenheit scale, water freezes at 32 F and boils at 212 F (at sea level). What is the data type and measurement scale of a dataset that records Fahrenheit temperature? a. Numerical and ratio b. Numerical and interva c. Categorical and ratio d. Categorical and ordinalarrow_forward
- Font Everest auto industry produces bearing for Mahindra Motor Corporation. The precision of radrus of bearing is very important for its successful functioning. To check the variability in the bearing radius, the company randomly selected ten bearings and measured the radius, the result of which is as shown in the table below. Nominal radius (cm) #no #no Nominal radius (cm) 2.45 1. 2.70 6. 71 8. 2. 2.65 2.73 3. 2.75 2.64 4. 2.55 9. 2.66 2.76 10 2.83 a. Calculate the sample standard deviation for the above data. b. Construct a box plot and check whether there is any outlier data m the data distribution. c. Based on the comparison between the mean and the quartile, identify the shape of the data distribution. d. Calculate the 55 percentile and interpret the result. e. What is the range of the data distribution? Explain sts meaning. d States)arrow_forwardIndicate the level of measurement for the data set described. Weights of newborn babies a. interval b. ratio c. nominal d. ordinalarrow_forwardGive an example for each measurement level by briefly explaining the measurement levels of the variables.arrow_forward
- Determine which of the four levels of measurement (nominal, ordinal, interval, ratio) is most appropriate for the data below. Brain volumes measured in cubic cmarrow_forwardScales of Measurement: Choose the letter of the best answer from the choicesarrow_forwardDetermine which of the four levels of measurement (nominal, ordinal, interval, ratio) is most appropriate for the data below. Internet speed levels of "fast," "medium," and "slow" Choose the correct answer below. O A. The ordinal level of measurement is most appropriate because the data can be ordered, but differences (obtained by subtraction) cannot be found or are meaningless. O B. The ratio level of measurement is most appropriate because the data can be ordered, differences (obtained by subtraction) can be found and are meaningful, and there is a natural starting point. OC. The interval level of measurement is most appropriate because the data can be ordered, differences (obtained by subtraction) can be found and are meaningful, and there is no natural starting point. O D. The nominal level of measurement is most appropriate because the data cannot be ordered.arrow_forward
- Please provide Handwritten answerarrow_forwardConsider the women's 100-yd dash (and the subsequent 100-m dash) in the Olympics since records have been kept. Determine the best way to combine all data and depict the data. Choose the correct answer below. O A. A stem and leaf plot would be the best way to show all of the data grouped by race times. O B. A line graph would be the best way to show all of the data over time, but some measurements would have to be converted to display the 100-yd and 100-m on the same graph. OC. Ahistogram would show all of the data by comparing each year. The units of distance would not matter. O D. A scatterplot would show the relationship between the 100-yd dash and the 100-m dash. Question Viewer Click to select your answer. 1: 2/2 Prt Scn 8 Home 19 End F10 DII F5 F7 F3 F4 F1 F2arrow_forwardINSTRUCTION: Provide Descriptive Statistics using the Data Analysis in Excel for the “Systolic Blood Pressure” set of data. Copy the result of the Descriptive Statistics in a short bond paper. Based on the dataset, what measure of central tendency (Mean, Median or Mode) should be used and explained? Interpret also the values in relation to Skewness and Kurtosis. NOTE: Place your answers in Microsoft Word Document (size: 8.5” x 11”).arrow_forward
arrow_back_ios
SEE MORE QUESTIONS
arrow_forward_ios
Recommended textbooks for you
 Glencoe Algebra 1, Student Edition, 9780079039897...AlgebraISBN:9780079039897Author:CarterPublisher:McGraw Hill
 Mathematics For Machine TechnologyAdvanced MathISBN:9781337798310Author:Peterson, John.Publisher:Cengage Learning,
 Holt Mcdougal Larson Pre-algebra: Student Edition...AlgebraISBN:9780547587776Author:HOLT MCDOUGALPublisher:HOLT MCDOUGAL
Glencoe Algebra 1, Student Edition, 9780079039897...
Algebra
ISBN:9780079039897
Author:Carter
Publisher:McGraw Hill
Mathematics For Machine Technology
Advanced Math
ISBN:9781337798310
Author:Peterson, John.
Publisher:Cengage Learning,
Holt Mcdougal Larson Pre-algebra: Student Edition...
Algebra
ISBN:9780547587776
Author:HOLT MCDOUGAL
Publisher:HOLT MCDOUGAL
what is Research Design, Research Design Types, and Research Design Methods; Author: Educational Hub;https://www.youtube.com/watch?v=LpmGSioXxdo;License: Standard YouTube License, CC-BY