
Concept explainers
Videos
Housing The following graph shows the annual number of housing starts in the United States during 2000–2008 together with a quadratic approximating model:
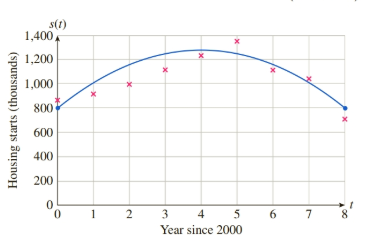
(t is the time in years since 2000.)4 At the same time, the homes being built were getting larger:
Use the given models to estimate the total housing area under construction over the given period. (Use

Trending nowThis is a popular solution!

Chapter 14 Solutions
Finite Mathematics and Applied Calculus (MindTap Course List)


 Algebra & Trigonometry with Analytic GeometryAlgebraISBN:9781133382119Author:SwokowskiPublisher:Cengage