
Videos
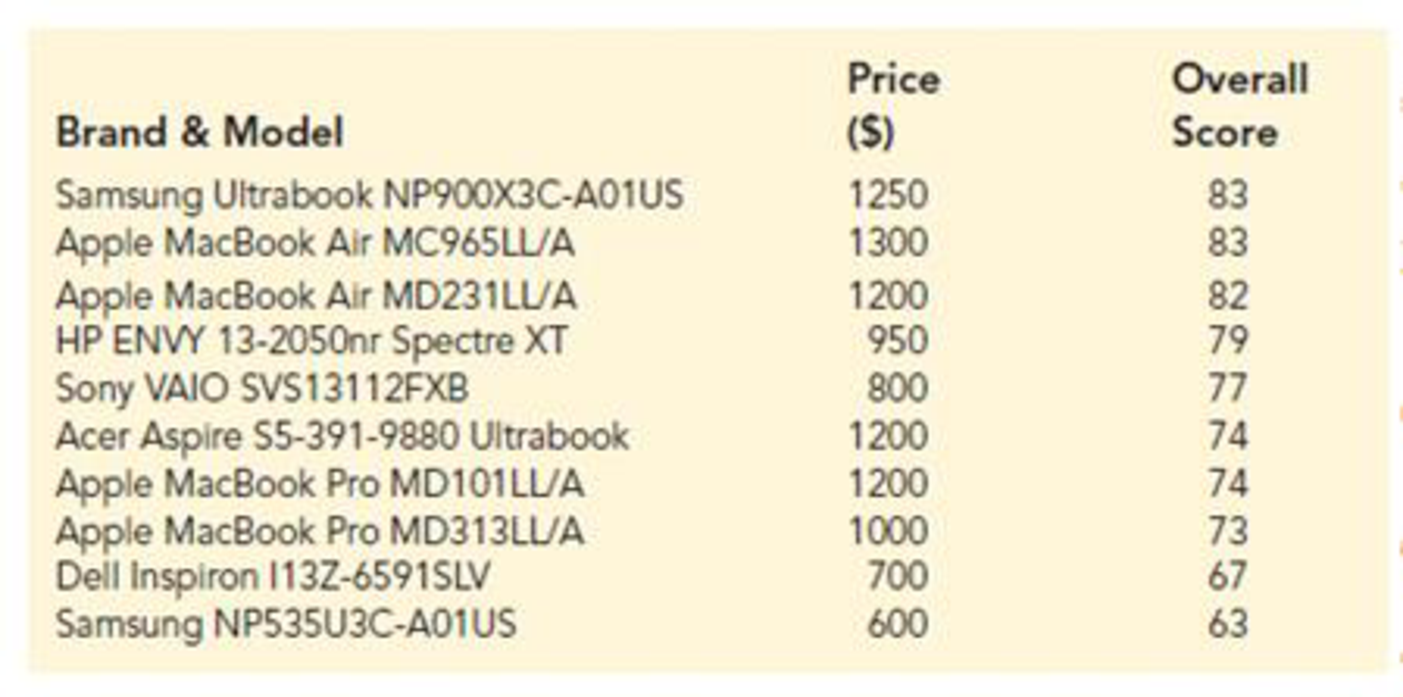
Laptop Ratings. To help consumers in purchasing a laptop computer, Consumer Reports calculates an overall test score for each computer tested based upon rating factors such as ergonomics, portability, performance, display, and battery life. Higher overall scores indicate better test results. The following data show the average retail price and the overall score for ten 13-inch models (Consumer Reports website).
- a. Develop a
scatter diagram with price as the independent variable. - b. What does the scatter diagram developed in part (a) indicate about the relationship between the two variables?
- c. Use the least squares method to develop the estimated regression equation.
- d. Provide an interpretation of the slope of the estimated regression equation.
- e. Another laptop that Consumer Reports tested is the Acer Aspire S3-951-6646 Ultrabook; the price for this laptop was $700. Predict the overall score for this laptop using the estimated regression equation developed in part (c).
a.
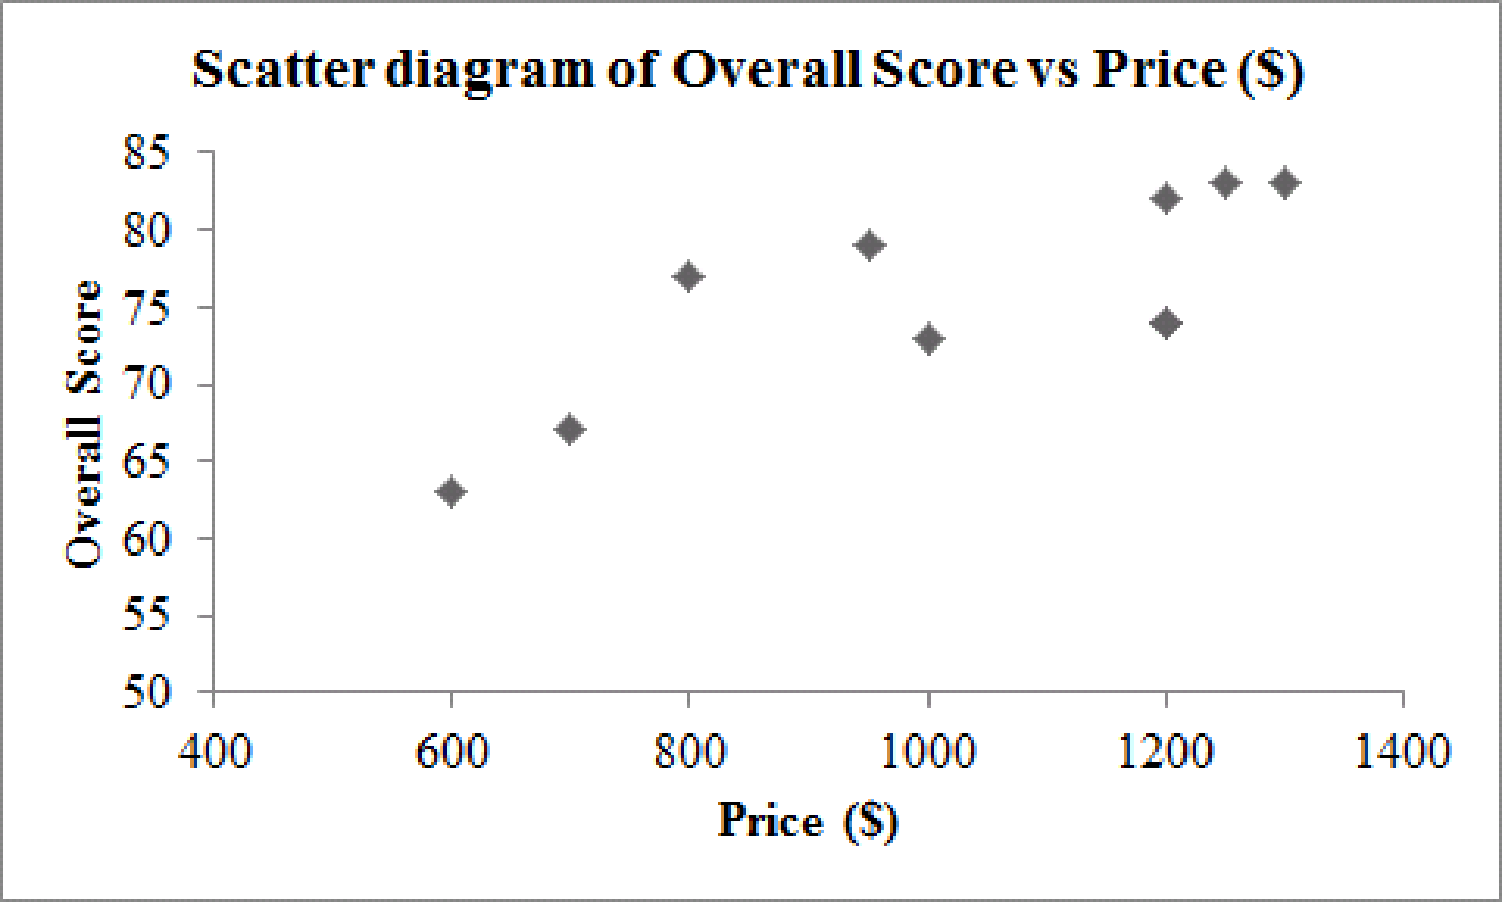
Obtain a scatter diagram for the data with price as the independent variable.
Answer to Problem 11E
The scatter diagram is obtained as follows:
Explanation of Solution
Calculation:
The data related to the price and overall score of 13-inches laptop for 8 branded companies.
Software procedure:
Step-by-step software procedure to obtain scatter diagram using EXCEL:
- Open an EXCEL file.
- In column A, enter the data of Price ($), and in column B, enter the corresponding values of Overall Score.
- Select the data that are to be displayed.
- Click on the Insert Tab > select Scatter icon.
- Choose a Scatter with only Markers.
- Click on the chart > select Layout from the Chart Tools.
- Select Axis Title > Primary Horizontal Axis Title > Title Below Axis.
- Enter Price ($) in the dialog box.
- Select Axis Title > Primary Vertical Axis Title > Rotated Title.
- Enter Overall Score in the dialog box.
b.
Explain the relationship between the two variables using the scatter diagram obtained in Part (a).
Explanation of Solution
As the overall score increases, the price of laptop also increases. Thus, the association between price and overall score is positive and linear.
Hence, the scatter diagram exhibits a positive linear relationship between price and overall score.
c.
Find the estimated regression equation using the least square method.
Answer to Problem 11E
The estimated regression equation is
Explanation of Solution
Calculation:
The simple linear regression model can be expressed as
Least squares criterion:
The least square criterion can be obtained by minimizing the sum of squares of difference between observed and predictor variables, that is,
Where
Slope and y-intercept of the estimated regression equation:
The slope can be obtained as follows:
The y–intercept is as follows:
where
n is the total number of observations.
It is known for a sample size n, the mean of a random variable x can be obtained as follows:
The price of laptop is considered as predictor variable (x) to predict the response variable (y), the overall score.
Thus, the mean of the random variable price of laptop (x) is obtained as follows:
Thus, the mean of the random variable number overall score (y) is obtained as follows:
The values of
| 1,250 | 230 | 83 | 7.5 | 1,725 | 52,900 |
| 1,300 | 280 | 83 | 7.5 | 2,100 | 78,400 |
| 1,200 | 180 | 82 | 6.5 | 1,170 | 32,400 |
| 950 | –70 | 79 | 3.5 | –245 | 49,00 |
| 800 | –220 | 77 | 1.5 | –330 | 48,400 |
| 1,200 | 180 | 74 | –1.5 | –270 | 32,400 |
| 1,200 | 180 | 74 | –1.5 | –270 | 32,400 |
| 1,000 | –20 | 73 | –2.5 | 50 | 400 |
| 700 | –320 | 67 | –8.5 | 2,720 | 102,400 |
| 600 | –420 | 63 | –12.5 | 5,250 | 176,400 |
| Total | 11,900 | 561,000 |
Thus, using the table, the slope of the estimated regression equation is obtained as follows:
Thus, using the value of slope, estimate the y–intercept of the estimated regression equation as follows:
Hence, the estimated regression equation is
d.
Provide the interpretation of the slope of the regression equation.
Explanation of Solution
From Part (c), it is found that the slope estimate of the regression equation is 0.0212.
As the slope gives the rapid change of y with respect to x, the overall score of 16 inches laptop is increased approximately by 2 points for every additional $100 in price.
e.
Predict the overall score for the laptop of price of $700.
Answer to Problem 11E
The predicted overall score for the laptop of price of $700 is 68.7.
Explanation of Solution
Calculation:
The price for the laptop is $700.
The predicted value of y for a specific value of x can be obtained using the estimated simple linear regression equation
From Part (c), it is found that the estimated regression equation is
Thus, the predicted overall score for the laptop of price of $700 is
obtained as follows:
Therefore, the predicted overall score for the laptop of price of $700 is 68.7.
Want to see more full solutions like this?
Chapter 14 Solutions
Modern Business Statistics with Microsoft Office Excel (with XLSTAT Education Edition Printed Access Card) (MindTap Course List)


 Glencoe Algebra 1, Student Edition, 9780079039897...AlgebraISBN:9780079039897Author:CarterPublisher:McGraw Hill
 Holt Mcdougal Larson Pre-algebra: Student Edition...AlgebraISBN:9780547587776Author:HOLT MCDOUGALPublisher:HOLT MCDOUGAL
 Functions and Change: A Modeling Approach to Coll...AlgebraISBN:9781337111348Author:Bruce Crauder, Benny Evans, Alan NoellPublisher:Cengage Learning
 Big Ideas Math A Bridge To Success Algebra 1: Stu...AlgebraISBN:9781680331141Author:HOUGHTON MIFFLIN HARCOURTPublisher:Houghton Mifflin Harcourt