
Elementary Statistics (13th Edition)
13th Edition
ISBN: 9780134462455
Author: Mario F. Triola
Publisher: PEARSON
expand_more
expand_more
format_list_bulleted
Concept explainers
Videos
Textbook Question
Chapter 14.2, Problem 1BSC
Statistical Literacy and Critical Thinking
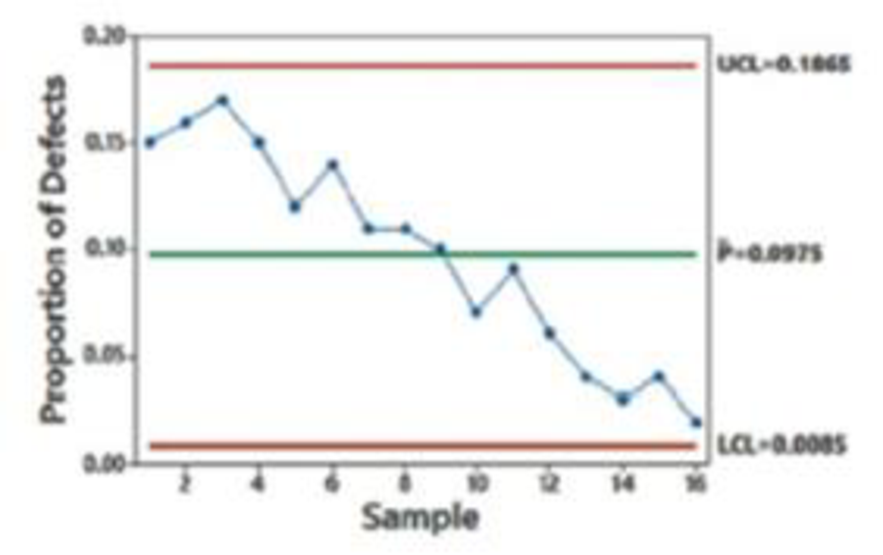
1. Minting Quarters Specifications for a quarter require that it be 8.33% nickel and 91.67% copper; it must weigh 5.670 g and have a diameter of 2426 mm and a thickness of 1.75 mm; and it must have 119 reeds on the edge. A quarter is considered to be defective if it deviates substantially from those specifications. A production process is monitored, defects are recorded and the accompanying control chart is obtained. Does this process appear to be within statistical control? If not identify any out-of-control criteria that are satisfied. Is the manufacturing process deteriorating?
Expert Solution & Answer

Trending nowThis is a popular solution!

Students have asked these similar questions
In an attempt to reduce the growth of its population, China instituted a policy limiting a familyto one child. Rural Chinese suggested revising the policy to limit families to one son. Assumingthe suggested policy is adopted and that any birth is as likely to produce a boy as a girl, and thesuccessive births are independent, explain the following:
(a) What would be the average family size?
(b)What would be the ratio of newborn boys to newborn girls?
a) If the prevalence rate is 50%, the sensitivity is 85%, and the specificity is 90%, what will the PPV value be?
b) What are possible slider values that will produce a PPV value of 1?
c) What are possible slider valuse that will produce an NPV value of 1?
d) If sensitivity and specificity remain constant while prevalence decreases, what effect does that have on the PPV?
e) If prevalence and specificity remain constant while sensitivity increases, what effect does that have on the NPV?
In a particularly small region in the Philippines, the consumer price index C depends on
Chapter 14 Solutions
Elementary Statistics (13th Edition)
Ch. 14.1 - FAA Requirement Table 14-1 on page 655 lists...Ch. 14.1 - Prob. 2BSCCh. 14.1 - Prob. 3BSCCh. 14.1 - Prob. 4BSCCh. 14.1 - Prob. 5BSCCh. 14.1 - Prob. 6BSCCh. 14.1 - Prob. 7BSCCh. 14.1 - Pepsi Cans. In Exercises 5-8, refer to the axial...Ch. 14.1 - Prob. 9BSCCh. 14.1 - Prob. 10BSC
Ch. 14.1 - Quarters. In Exercises 9-12, refer to the...Ch. 14.1 - Prob. 12BSCCh. 14.1 - Prob. 13BBCh. 14.1 - Prob. 14BBCh. 14.2 - Statistical Literacy and Critical Thinking 1....Ch. 14.2 - Prob. 2BSCCh. 14.2 - Control Limits In constructing a control chart for...Ch. 14.2 - Euro Coins After constructing a control chart for...Ch. 14.2 - Control Charts for p. In Exercises 5-12, use the...Ch. 14.2 - Control Charts for p. In Exercises 5-12, use the...Ch. 14.2 - Prob. 7BSCCh. 14.2 - Control Charts for p. In Exercises 5-12, use the...Ch. 14.2 - Control Charts for p. In Exercises 5-12, use the...Ch. 14.2 - Control Charts for p. In Exercises 5-12, use the...Ch. 14.2 - Control Charts for p. In Exercises 5-12, use the...Ch. 14.2 - Control Charts for p. In Exercises 5-12, use the...Ch. 14.2 - Prob. 13BBCh. 14 - What are process data?Ch. 14 - Prob. 2CQQCh. 14 - Prob. 3CQQCh. 14 - Prob. 4CQQCh. 14 - Prob. 5CQQCh. 14 - Prob. 6CQQCh. 14 - Prob. 7CQQCh. 14 - Prob. 8CQQCh. 14 - Prob. 9CQQCh. 14 - Prob. 10CQQCh. 14 - Prob. 1RECh. 14 - Prob. 2RECh. 14 - Prob. 3RECh. 14 - Energy Consumption. Exercises 15 refer to the...Ch. 14 - Prob. 5RECh. 14 - Prob. 1CRECh. 14 - Prob. 2CRECh. 14 - Prob. 3CRECh. 14 - Internet Doctors: Probability Based on the survey...Ch. 14 - Sunspots and the DJIA Listed below are annual...Ch. 14 - Prob. 6CRECh. 14 - Prob. 7CRECh. 14 - Defective Child Restraint Systems The Tracolyte...Ch. 14 - Prob. 9CRECh. 14 - Does It Pay to Plead Guilty? The accompanying...Ch. 14 - FROM DATA TO DECISION Critical Thinking: Are the...
Knowledge Booster


Learn more about
Need a deep-dive on the concept behind this application? Look no further. Learn more about this topic, statistics and related others by exploring similar questions and additional content below.Similar questions
- The prices and the numbers of various items produced by a small machine and stamping plant are reported below. Use 2010 as the base. 2010 2018 Item Price (in $) Quantity Price (in $) Quantity Washer 0.07 17,000 0.10 20,000 Cotter pin 0.04 125,000 0.03 130,000 Stove bolt 0.15 40,000 0.15 42,000 Hex nut 0.08 62,000 0.10 65,000 a. Determine the Laspeyres price index. (Round your answer to 2 decimal places.) b. Determine the Paasche price index. (Round your answer to 2 decimal places.)arrow_forwardCALCULATING MACRONUTRIENT REQUIREMENTS 1. Calculate the macronutrient requirements of a 26-year-old male gym instructor whose TCR is 2,800 kcal per day using the following distribution: Carbohydrate: 50% Fat: 20% Protein: 30% 2. Calculate the macronutrient requirements of a female with a height of 5'6" and moderate physical activity using the following distribution: Carbohydrate: 60% Fats: 20% Protein: 20% 3. Calculate the macronutrient requirements of a 22-year-old female whose TCR is 1,500 kcal per day using the following distribution: Carbohydrate: 65% Fat: 20% Protein: 15%arrow_forwardIn an ongoing nationwide survey, a question asked is whether a respondent favors or opposes capital punishment (the death penalty) for persons convicted of murder. The output for this exercise compares the proportions who said that they were opposed to the death penalty in the year 2008 and the year 1993. Sample X N Sample p 2008 637 1912 0.333 1993 333 1418 0.235 Estimate for p(1) − p(2): 0.098 95% CI for p(1) − p(2): (0.068, 0.129) (a) What proportion of the year 2008 sample was opposed to the death penalty? (Round your answer to three decimal places.) What proportion of the year 1993 sample was opposed? (Round your answer to three decimal places.) (b) What is the estimated difference between the proportions opposed to the death penalty in the 2 years? (Use p2008 − p1993. Round your answer to three decimal places.) (c) Write the 95% confidence interval as it is given in the output. to Interpret this interval in the context of this situation. There is a…arrow_forward
- A hypothetical data regarding consumption of fast food observed among the adults of a country is shown in the table below Gender Number (in thousand) Number (in thousand) People above 18 years Fast food consumers Male 62,384 28,689 Female 66,778 31,083 Use the data to calculate: 1. Sex ratio of male to female fast food consumers 2. Proportion of female who consume fast food 3. Prevalence per 1,000 of fast food consumption in: a) men only b) women only c) total population aged above 18 yearsarrow_forwardConstruct a hypothesis addressing which potato piece will have the greatest surface-area-to-volume ratio. Explain. Table 1a Why Are Cells Small Length (l) (cm) Width (w) (cm) Height (h) (cm) Size of Cross Section (h x w) (cm) Distance Traveled by IKI from Potato Edge (cm) Area of White Region (l x w) (cm) 2.50 2.50 2.50 6.25 cm 0.20 cm 2.64 cm 2.00 2.00 1.00 2.00cm 0.30 cm 1.87 cm 1.50 1.50 1.50 2.25 cm 0.50 cm 1.50 cm 1.00 1.00 1.00 1.00 cm 0.40 0.60 cm 2.00 0.50 0.50 0.25 cm 0.20 cm 0.15 cm 0.50 0.50 0.50 0.25 cm 0.30 cm 0.10 cmarrow_forwardA pharmaceutical company states that there is 500mg of active ingredient in each capsule for one of the medicines they manufacture. However, the FDA believes the company is purposely underfilling the capsule to save money. A sample of 20 capsules is taken and the amount of active ingredient inside is measured. The results are below: 484 460 471 512 494 529 494 485 474 502 503 538 466 495 475 529 518 464 449 489 Part 1: Construct a 95% confidence interval using toolPAK for the amount of active ingredient measured. Use the appropriate distribution, and specify the upper and lower limits of the interval. Part 2: Carefully interpret the 95% confidence interval? What if you did constructed a Confidence Interval Manually? Part 3: Does the 95% confidence interval support the FDA’s claim? Explain. Part 4: Would your answer change if the confidence level was lowered to 75%? Explain.arrow_forward
- In each case below, give a brief discourse on the consequences that might result from the error listed. A) A type I error occurs in the determination of caffeine content (Relative to stated content) in an energy drink. (no hypothesis is that The caffeine content is at least as high as stated on the can.) B) A type II error occurs in the determination that the lead level in an industry waste stream is below the EP mandated level.arrow_forward9.17 Iron Deficiency? Iron is essential to most life forms and to normal human physiology. It is an integral part of many proteins and enzymes that maintain good health. Recommendations for iron are provided in Dietary Reference Intakes, developed by the Institute of Medicine of the National Academy of Sciences. The recommended dietary allowance (RDA) of iron for adult females under the age of 51 years is 18 milligrams (mg) per day. A hypothesis test is to be performed to decide whether adult females under the age of 51 years are, on average, getting less than the RDA of 18 mg of iron. 9.25 Iron Deficiency? Refer to Exercise 9.17. Explain what each of the following would mean. a. Type I errorb. Type II error c. Correct decisionNow suppose that the results of carrying out the hypothesis test lead to rejection of the null hypothesis. Classify that conclusion by error type or as a correct decision if in fact the mean iron intake of all adult females under the age of 51 years d. equals…arrow_forwardHow many of the most important techological catalyst for change, shown in the Data attached, were the HRDs required to select when completing the survey? A) 1 B) 2 C) 3 D) 4 E) 5arrow_forward
- Life-saving drug: Penicillin is produced by the Penicillin fungus, which is grown in a broth whose sugar content must be carefully controlled. Several samples of broth were taken on three successive days, and the amount of dissolved sugars, in milligrams per milliliter, was measured on each sample. The results were as follows. Day 1: 5.2 5.0 5.4 5.2 5.3 5.0 4.9 5.0 5.2 5.0 4.6 5.3 Day 2: 5.6 4.8 4.9 5.3 5.2 4.9 5.4 5.0 5.4 4.9 5.5 5.4 Day 3: 5.9 4.9 5.3 5.4 5.2 5.5 5.0 5.8 5.5 5.4 5.4 5.1 Construct an ANOVA table. Round your answers to four decimal places as needed. One-way ANOVA: Sugar Concentration Source DF SS MS F P Days Error Totalarrow_forwardPeriodically, the county Water Department tests the drinking water of homeowners for contminants such as lead and copper. The lead and copper levels in water specimens collected in 1998 for a sample of 10 residents of a subdevelopement of the county are shown below. lead (?μg/L) copper (mg/L) 3.33.3 0.6280.628 3.33.3 0.2930.293 0.30.3 0.7830.783 4.74.7 0.1950.195 55 0.3780.378 1.41.4 0.2330.233 0.90.9 0.1010.101 0.90.9 0.6980.698 3.63.6 0.80.8 1.21.2 0.7610.761 (a) Construct a 99% confidence interval for the mean lead level in water specimans of the subdevelopment. _____≤μ≤_____ (b) Construct a 99% confidence interval for the mean copper level in water specimans of the subdevelopment. ______≤μ≤______arrow_forward(6.15)- Refer to the data in Table 2.13. Regard this hospital as typical of Pennsylvania hospitals. A-What is the best point estimate of the percentage of males among patients discharged from Pennsylvania hospitals?B-What is the standard error of the estimate obtained in Problem A?C-Provide a 95% CI for the percentage of males among patients discharged from Pennsylvania hospitalsarrow_forward
arrow_back_ios
SEE MORE QUESTIONS
arrow_forward_ios
Recommended textbooks for you
 MATLAB: An Introduction with ApplicationsStatisticsISBN:9781119256830Author:Amos GilatPublisher:John Wiley & Sons Inc
 Probability and Statistics for Engineering and th...StatisticsISBN:9781305251809Author:Jay L. DevorePublisher:Cengage Learning
 Statistics for The Behavioral Sciences (MindTap C...StatisticsISBN:9781305504912Author:Frederick J Gravetter, Larry B. WallnauPublisher:Cengage Learning
 Elementary Statistics: Picturing the World (7th E...StatisticsISBN:9780134683416Author:Ron Larson, Betsy FarberPublisher:PEARSON
 The Basic Practice of StatisticsStatisticsISBN:9781319042578Author:David S. Moore, William I. Notz, Michael A. FlignerPublisher:W. H. Freeman
 Introduction to the Practice of StatisticsStatisticsISBN:9781319013387Author:David S. Moore, George P. McCabe, Bruce A. CraigPublisher:W. H. Freeman
MATLAB: An Introduction with Applications
Statistics
ISBN:9781119256830
Author:Amos Gilat
Publisher:John Wiley & Sons Inc
Probability and Statistics for Engineering and th...
Statistics
ISBN:9781305251809
Author:Jay L. Devore
Publisher:Cengage Learning
Statistics for The Behavioral Sciences (MindTap C...
Statistics
ISBN:9781305504912
Author:Frederick J Gravetter, Larry B. Wallnau
Publisher:Cengage Learning
Elementary Statistics: Picturing the World (7th E...
Statistics
ISBN:9780134683416
Author:Ron Larson, Betsy Farber
Publisher:PEARSON
The Basic Practice of Statistics
Statistics
ISBN:9781319042578
Author:David S. Moore, William I. Notz, Michael A. Fligner
Publisher:W. H. Freeman
Introduction to the Practice of Statistics
Statistics
ISBN:9781319013387
Author:David S. Moore, George P. McCabe, Bruce A. Craig
Publisher:W. H. Freeman
Continuous Probability Distributions - Basic Introduction; Author: The Organic Chemistry Tutor;https://www.youtube.com/watch?v=QxqxdQ_g2uw;License: Standard YouTube License, CC-BY
Probability Density Function (p.d.f.) Finding k (Part 1) | ExamSolutions; Author: ExamSolutions;https://www.youtube.com/watch?v=RsuS2ehsTDM;License: Standard YouTube License, CC-BY
Find the value of k so that the Function is a Probability Density Function; Author: The Math Sorcerer;https://www.youtube.com/watch?v=QqoCZWrVnbA;License: Standard Youtube License