
Modern Business Statistics with Microsoft Office Excel (with XLSTAT Education Edition Printed Access Card) (MindTap Course List)
6th Edition
ISBN: 9781337115186
Author: David R. Anderson, Dennis J. Sweeney, Thomas A. Williams, Jeffrey D. Camm, James J. Cochran
Publisher: Cengage Learning
expand_more
expand_more
format_list_bulleted
Concept explainers
Videos
Textbook Question
Chapter 14.3, Problem 18E
Price and Quality of Headphones. The following data show the brand, price ($), and the overall score for six stereo headphones that were tested by Consumer Reports (Consumer Reports website). The overall score is based on sound quality and effectiveness of ambient noise reduction. Scores
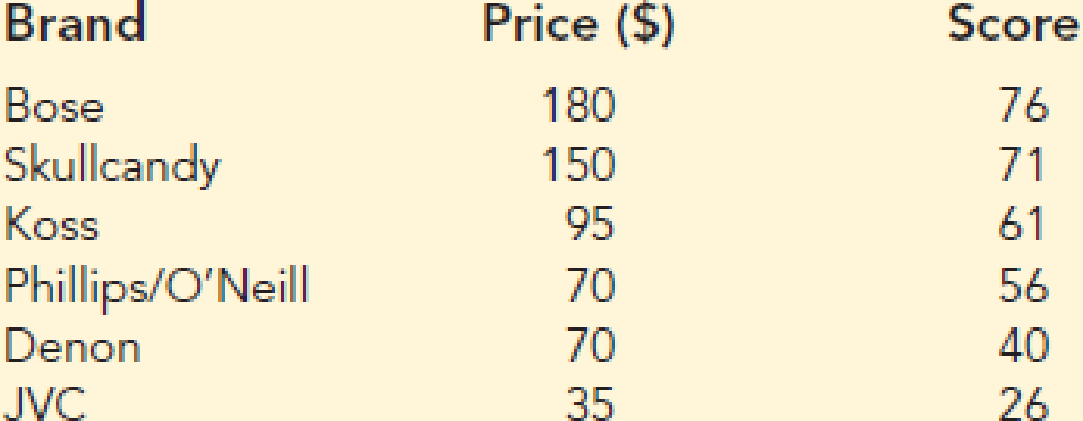
- a. Compute SST, SSR, and SSE.
- b. Compute the coefficient of determination r2. Comment on the goodness of fit.
- c. What is the value of the sample
correlation coefficient ?
Expert Solution & Answer
Want to see the full answer?
Check out a sample textbook solution
Students have asked these similar questions
A car dealer wants to estimate the price of a used car based on the age of the car and the mileage. Based on a sample of 20 cars, she determines the sample regression equation that predicts price taxes on the basis of the age (in years) of the number of miles is
Price=21,510-1230Age-0.035 Miles
(a) If the age of the car was fixed and the mileage was increased by 10,000, would the price increase or decrease and by how much?
(b) Predict the selling price of a five-year-old car with 65,000 miles. (Round your answers to the nearest whole number.)
Develop an estimated multiple regression equation that relates risk of a stroke to a person's age, systolic blood pressure and whether the person is a smoker.
x1=persons age
x2systrolic blood pressure
x3=whether person is a smoker or non smoker
A social scientist collects information about counties in California and finds that the correlation between average income of the county and a rating of healthcare quality in the county is 0.78. A scatterplot of the two variables is football shaped.
A particular county has an average income that is 0.4 SDs above the average of all counties.
Using regression, we would predict that its healthcare quality is _________ SDs above the average healthcare quality for all counties, and that it is therefore at the _________ percentile of healthcare quality among all counties.
Choose the answer below to fill in the two blanks.
Group of answer choices
0.31; 24th
0.78; 58th
0.78; 79th
0.31; 62nd
PreviousNext
Chapter 14 Solutions
Modern Business Statistics with Microsoft Office Excel (with XLSTAT Education Edition Printed Access Card) (MindTap Course List)
Ch. 14.2 - Given are five observations for two variables, x...Ch. 14.2 - Given are five observations for two variables, x...Ch. 14.2 - Given are five observations collected in a...Ch. 14.2 - Retail and Trade: Female Managers. The following...Ch. 14.2 - Production Line Speed and Quality Control. Brawdy...Ch. 14.2 - The National Football League (NFL) records a...Ch. 14.2 - Sales Experience and Performance. A sales manager...Ch. 14.2 - Broker Satisfaction. The American Association of...Ch. 14.2 - Companies in the U.S. car rental market vary...Ch. 14.2 - Age and the Price of Wine. For a particular red...
Ch. 14.2 - Laptop Ratings. To help consumers in purchasing a...Ch. 14.2 - Stock Beta. In June of 2016, Yahoo Finance...Ch. 14.2 - Distance and Absenteeism. A large city hospital...Ch. 14.2 - Using a global-positioning-system (GPS)-based...Ch. 14.3 - 15. The data from exercise 1...Ch. 14.3 - The data from exercise 2 follow.
The estimated...Ch. 14.3 - Prob. 17ECh. 14.3 - Price and Quality of Headphones. The following...Ch. 14.3 - Sales Experience and Sales Performance. In...Ch. 14.3 - Price and Weight of Bicycles. Bicycling, the...Ch. 14.3 - Cost Estimation. An important application of...Ch. 14.3 - 22. Refer to exercise 9, where the following data...Ch. 14.5 - The data from exercise 1 follow.
Compute the mean...Ch. 14.5 - The data from exercise 2 follow.
Compute the mean...Ch. 14.5 - The data from exercise 3 follow.
What is the...Ch. 14.5 - Prob. 26ECh. 14.5 - To identify high-paying jobs for people who do not...Ch. 14.5 - Broker Satisfaction Conclusion. In exercise 8,...Ch. 14.5 - Cost Estimation Conclusion. Refer to exercise 21,...Ch. 14.5 - Significance of Fleet Size on Rental Car Revenue....Ch. 14.5 - Significance of Racing Bike Weight on Price. In...Ch. 14.6 - 32. The data from exercise 1...Ch. 14.6 - 33. The data from exercise 2...Ch. 14.6 - Prob. 34ECh. 14.6 - 35. The following data are the monthly salaries y...Ch. 14.6 - 36. In exercise 7, the data on y = annual sales ($...Ch. 14.6 - In exercise 5, the following data on x = the...Ch. 14.6 - Prob. 38ECh. 14.6 - 39. In exercise 12, the following data on x =...Ch. 14.7 - The commercial division of a real estate firm...Ch. 14.7 - Following is a portion of the regression output...Ch. 14.7 - Prob. 43ECh. 14.7 - Auto Racing Helmet. Automobile racing,...Ch. 14.8 - Prob. 45ECh. 14.8 - Prob. 46ECh. 14.8 - Prob. 47ECh. 14.8 - Prob. 48ECh. 14.8 - Prob. 49ECh. 14.9 - Consider the following data for two variables, x...Ch. 14.9 - Prob. 51ECh. 14.9 - Predicting Charity Expenses. Charity Navigator is...Ch. 14.9 - Many countries, especially those in Europe, have...Ch. 14.9 - Valuation of a Major League Baseball Team. The...Ch. 14 - The Dow Jones Industrial Average (DJIA) and the...Ch. 14 - Home Sire and Price. Is the number of square feet...Ch. 14 - Online Education. One of the biggest changes in...Ch. 14 - Machine Maintenance. Jensen Tire & Auto is in the...Ch. 14 - Bus Maintenance. The regional transit authority...Ch. 14 - Studying and Grades. A marketing professor at...Ch. 14 - Used Car Mileage and Price. The Toyota Camry is...Ch. 14 - One measure of the risk or volatility of an...Ch. 14 - As part of a study on transportation safety, the...Ch. 14 - Consumer Reports tested 166 different...Ch. 14 - When trying to decide what car to buy, real value...Ch. 14 - Buckeye Creek Amusement Park is open from the...
Knowledge Booster


Learn more about
Need a deep-dive on the concept behind this application? Look no further. Learn more about this topic, statistics and related others by exploring similar questions and additional content below.Similar questions
- If your graphing calculator is capable of computing a least-squares sinusoidal regression model, use it to find a second model for the data. Graph this new equation along with your first model. How do they compare?arrow_forwardcreate graph of the two-variable data with a regression line, r, r2, and separate residual plotarrow_forwardThe following data table shows the historical data for the first semester 2020, of the amount of sales of the company "IRC", which sells sneakers. Utilizing multiple lineal regression (as shown on the image), find an equation that estimates the number of sneakers sold by the company, based on advertising and revenue. Also, determine the standard error of estimation, the coefficient of determination, and the correlation coefficient. Write down what was the quantity in thousands sold in July if the amount of ads was 8 and the income for each unit was $135arrow_forward
- What is the equation of the regression linearrow_forwardA researcher investigated the relationship between family income and savings. Using data from 15 families, the computed r between income and savings was found to be 0.76. The researcher wants to test if there is a significant relationship between the two variables at 5% level of significance and create a regression equation to predict the possible savings given the income of the family. Interpret the computed r value. Test if there is a significant relationship between the two variables at 5% level of significancearrow_forwardHow are the slope and intercept of a simple linear regression line calculated? What do they tell us about the relationship between the two variables?arrow_forward
- Assume that you want to predict Company Performance based on the linear effects of Trust and Commitment that exist among a company’s employees c) If you want to test whether there is a linear effect of Commitment and a curvilinear effect of Trust on Company Performance—such that Company Performance increases up to a certain level of Trust, after which Company Performance diminishes with increasing Trust levels—how would your regression equation look like? Further, explain your answer in your own words. Provide at least two sentences of explanation, in addition to giving the regression equation.arrow_forwardMarina, Elena, Paloma, Alejandra and Rocío are 2, 3, 5, 7 and 8 years old and weigh 14, 20, 30, 42 and 44 kg respectively. With these data:(a) Find the equation of the regression line of age on weight.b) Estimate the approximate "weight" for a 6-year-old girl.arrow_forward** had to resubmit this question because the first time the data was duplicated and reflected incorrectly. The table below gives the number of hours spent unsupervised each day as well as the overall grade averages for seven randomly selected middle school students. Using this data, consider the equation of the regression line, yˆ=b0+b1xy^=b0+b1x, for predicting the overall grade average for a middle school student based on the number of hours spent unsupervised each day. Keep in mind, the correlation coefficient may or may not be statistically significant for the data given. Remember, in practice, it would not be appropriate to use the regression line to make a prediction if the correlation coefficient is not statistically significant. Hours Unsupervised 1 2 3 4 5 5.5 6 Overall Grades 96 89 87 77 76 68 64 **Please circle the answer for each step so I don't get confused. Thanks in advance for helping me with the breakdown and notes** Step 1 of 6 : Find the…arrow_forward
- The table below gives the number of hours five randomly selected students spent studying and their corresponding midterm exam grades. Using this data, consider the equation of the regression line, yˆ=b0+b1xy^=b0+b1x, for predicting the midterm exam grade that a student will earn based on the number of hours spent studying. Keep in mind, the correlation coefficient may or may not be statistically significant for the data given. Remember, in practice, it would not be appropriate to use the regression line to make a prediction if the correlation coefficient is not statistically significant. Hours of studying 0 1 2 4 5 Midterm Grades 67 77 83 97 99 Find the estiamted slope. round answer 3 decimal placesarrow_forwardThe table below gives the number of hours five randomly selected students spent studying and their corresponding midterm exam grades. Using this data, consider the equation of the regression line, yˆ=b0+b1xy^=b0+b1x, for predicting the midterm exam grade that a student will earn based on the number of hours spent studying. Keep in mind, the correlation coefficient may or may not be statistically significant for the data given. Remember, in practice, it would not be appropriate to use the regression line to make a prediction if the correlation coefficient is not statistically significant. Hours Studying 0 1 2 4 5 Midterm grades 67 77 83 97 99 find the y intercept and round to three decimal placesarrow_forwardThe table below gives the number of hours five randomly selected students spent studying and their corresponding midterm exam grades. Using this data, consider the equation of the regression line, yˆ=b0+b1xy^=b0+b1x, for predicting the midterm exam grade that a student will earn based on the number of hours spent studying. Keep in mind, the correlation coefficient may or may not be statistically significant for the data given. Remember, in practice, it would not be appropriate to use the regression line to make a prediction if the correlation coefficient is not statistically significant. hours studying 0 1 3 4 5 grades 63 65 80 81 87 Calculate the correlation coefficient, r. Round your answer to three decimal places.arrow_forward
arrow_back_ios
SEE MORE QUESTIONS
arrow_forward_ios
Recommended textbooks for you
 Trigonometry (MindTap Course List)TrigonometryISBN:9781305652224Author:Charles P. McKeague, Mark D. TurnerPublisher:Cengage Learning
Trigonometry (MindTap Course List)
Trigonometry
ISBN:9781305652224
Author:Charles P. McKeague, Mark D. Turner
Publisher:Cengage Learning
Correlation Vs Regression: Difference Between them with definition & Comparison Chart; Author: Key Differences;https://www.youtube.com/watch?v=Ou2QGSJVd0U;License: Standard YouTube License, CC-BY
Correlation and Regression: Concepts with Illustrative examples; Author: LEARN & APPLY : Lean and Six Sigma;https://www.youtube.com/watch?v=xTpHD5WLuoA;License: Standard YouTube License, CC-BY