
Videos
Consider the accompanying 2 × 3 table displaying the sample proportions that fell in the various combinations of categories (e.g., 13% of those in the sample were in the first category of both factors).
| 1 | 2 | 3 | |
| 1 | .13 | .19 | .28 |
| 2 | .07 | .11 | .22 |
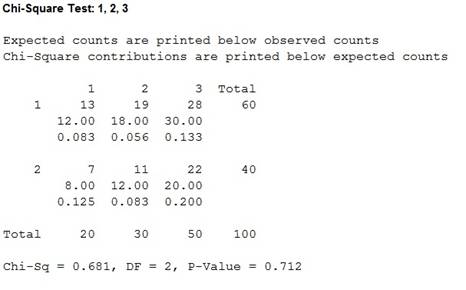
a. Suppose the sample consisted of n = 100 people. Use the chi-squared test for independence with significance level .10.
b. Repeat part (a), assuming that the
c. What is the smallest sample size n for which these observed proportions would result in rejection of the independence hypothesis?
a.
Use chi-square test of independence for sample size of 100 at 10% level of significance to test the independence of the factors.
Answer to Problem 36E
There is no sufficient evidence to conclude that two factors are dependent at 10% level of significance.
Explanation of Solution
Given info:
A
Calculation:
The number of observed frequency for each cell is calculated as follows:
| 1 | 2 | 3 | |
| 1 | |||
| 2 |
The claim is to test whether the two factors are dependent. If the claim is rejected, then the two factors are independent of each other.
Testing the hypothesis:
Null hypothesis:
That is, the two factors are independent.
Alternative hypothesis:
Test statistic:
Software procedure:
Step-by-step procedure to find the chi-square test statistic using MINITAB is given below:
- Choose Stat > Tables > Chi-Square Test (Two-Way Table in Worksheet).
- In Columns containing the table, enter the columns of 1, 2 and 3.
- Click OK.
Output obtained from MINITAB is given below:
Decision rule:
If
If
Conclusion:
The P-value is 0.712 and the level of significance is 0.10.
The P-value is greater than the level of significance.
That is,
Hence, the null hypothesis is not rejected.
Thus, there is no sufficient evidence to conclude that two factors are dependent at 10% level of significance.
b.
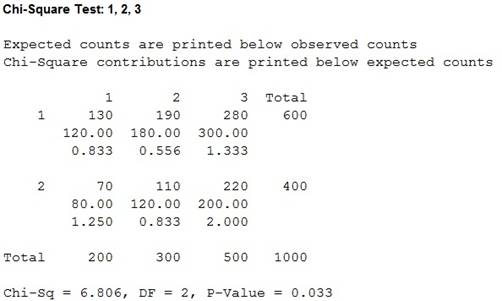
Use chi-square test of independence for sample size of 1,000 at 10% level of significance.
Answer to Problem 36E
There is sufficient evidence to conclude that two factors are dependent.
Explanation of Solution
Given info:
A
Calculation:
The claim is to test whether the two factors are dependent. If the claim is rejected, then the two factors are independent of each other.
Testing the hypothesis:
Null hypothesis:
That is, the two factors are independent.
Alternative hypothesis:
Software procedure:
Step-by-step procedure to find the chi-square test statistic using MINITAB is given below:
- Choose Stat > Tables > Chi-Square Test (Two-Way Table in Worksheet).
- In Columns containing the table, enter the columns of 1, 2 and 3
- Click OK.
Output obtained from MINITAB is given below:
Decision rule:
If
If
Conclusion:
The P-value is 0.033 and the level of significance is 0.10.
The P-value is lesser than the level of significance.
That is,
Hence, the null hypothesis is rejected.
Thus, there is sufficient evidence to conclude that two factors are dependent.
c.
Identify the smallest sample size n where the rejection of null hypothesis would happen.
Answer to Problem 36E
The smallest sample size n where the rejection of null hypothesis would happen is 677.
Explanation of Solution
Calculation:
Multiply the sample size n across all cells to get the observed frequency:
| 1 | 2 | 3 | ||
| 1 | 0.60n | |||
| 2 | 0.40n | |||
| Total | 0.20n | 0.30n | 0.50n | 1.00n |
Expected frequency:
The expected frequency for a cell is calculated by,
Where,
n represents the sample size.
Test statistic:
Where,
The table shows the calculation for chi-square test statistic:
| Factors |
Observed |
Expected | |
| 1/1 | 0.13n | 0.12n | 0.000833n |
| 1/2 | 0.19n | 0.18n | 0.000556n |
| 1/3 | 0.28n | 0.30n | 0.001333n |
| 2/1 | 0.07n | 0.08n | 0.00125n |
| 2/2 | 0.11n | 0.12n | 0.000833n |
| 2/3 | 0.22n | 0.20n | 0.002n |
| Total | 0.006805556n |
Critical value:
Use the Table A.7 to find the chi-square critical values.
- Locate 2 under the column of v.
- In the row of
- The value intersecting these two numbers gives the critical value corresponding to
Thus, the critical value is
Decision rule:
The null hypothesis would be rejected if the P-value is lesser than or equal to the level of significance
Conclusion:
Here,
That is,
Hence, the sample size is 677.
Want to see more full solutions like this?
Chapter 14 Solutions
Probability and Statistics for Engineering and the Sciences


 MATLAB: An Introduction with ApplicationsStatisticsISBN:9781119256830Author:Amos GilatPublisher:John Wiley & Sons Inc
 Probability and Statistics for Engineering and th...StatisticsISBN:9781305251809Author:Jay L. DevorePublisher:Cengage Learning
 Statistics for The Behavioral Sciences (MindTap C...StatisticsISBN:9781305504912Author:Frederick J Gravetter, Larry B. WallnauPublisher:Cengage Learning
 Elementary Statistics: Picturing the World (7th E...StatisticsISBN:9780134683416Author:Ron Larson, Betsy FarberPublisher:PEARSON
 The Basic Practice of StatisticsStatisticsISBN:9781319042578Author:David S. Moore, William I. Notz, Michael A. FlignerPublisher:W. H. Freeman
 Introduction to the Practice of StatisticsStatisticsISBN:9781319013387Author:David S. Moore, George P. McCabe, Bruce A. CraigPublisher:W. H. Freeman