
Concept explainers
Videos
Significance of Racing Bike Weight on Price. In exercise 20, data on x = weight (pounds) and y = price ($) for 10 road-racing bikes provided the estimated regression equation
20. Price and Weight of Bicycles. Bicycling, the world’s leading cycling magazine, reviews hundreds of bicycles throughout the year. Their “Road-Race” category contains reviews of bikes used by riders primarily interested in racing. One of the most important factors in selecting a bike for racing is the weight of the bike. The following data show the weight (pounds) and price ($) for 10 racing bikes reviewed by the magazine (Bicycling website).
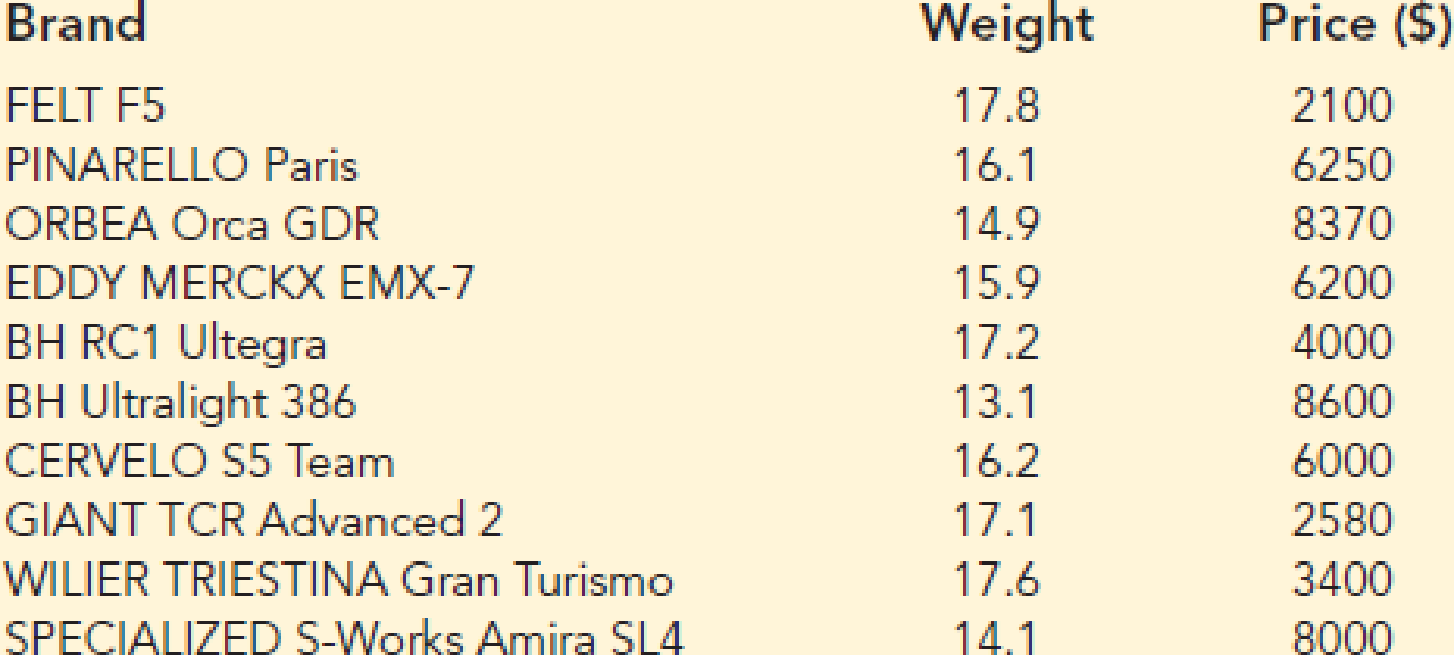
- a. Use the data to develop an estimated regression equation that could be used to estimate the price for a bike given the weight.
- b. Compute r2. Did the estimated regression equation provide a good fit?
- c. Predict the price for a bike that weighs 15 pounds.
Want to see the full answer?
Check out a sample textbook solution
Chapter 14 Solutions
Modern Business Statistics with Microsoft Office Excel (with XLSTAT Education Edition Printed Access Card) (MindTap Course List)


- A researcher is hired to investigate the relationship between the number of unauthorized days that employees are absent per year and the distance in miles between home and work for the employees. A sample of 10 employees was chosen and the results are listed in the chart below. Use the proper Data Analysis function in Excel to computethe regression equation needed to predict the number of missed days that could be expected foremployees who live certain distances away from the workplace. Distance to Work (miles): 1, 3, 4, 6, 9, 10, 12, 14, 14, 18 Number of Days Absent: 9, 6, 7, 7, 6, 4, 5, 3, 4, 2arrow_forwardA car dealer wants to estimate the price of a used car based on the age of the car and the mileage. Based on a sample of 20 cars, she determines the sample regression equation that predicts price taxes on the basis of the age (in years) of the number of miles is Price=21,510-1230Age-0.035 Miles (a) If the age of the car was fixed and the mileage was increased by 10,000, would the price increase or decrease and by how much? (b) Predict the selling price of a five-year-old car with 65,000 miles. (Round your answers to the nearest whole number.)arrow_forwardThe table below gives the number of hours five randomly selected students spent studying and their corresponding midterm exam grades. Using this data, consider the equation of the regression line, y^=b0+b1x, for predicting the midterm exam grade that a student will earn based on the number of hours spent studying. Keep in mind, the correlation coefficient may or may not be statistically significant for the data given. Remember, in practice, it would not be appropriate to use the regression line to make a prediction if the correlation coefficient is not statistically significant. Hours Studying 1 2 4 5 6 Midterm Grades 67 68 70 79 87 Summation Table x y xy x2 y2 Student 1 1 67 67 1 4489 Student 2 2 68 136 4 4624 Student 3 4 70 280 16 4900 Student 4 5 79 395 25 6241 Student 5 6 87 522 36 7569 Sum 18 371 1400 82 27823 Step 1 of 6: Find the estimated slope. Round your answer to three decimal places. Step 2 of 6: Find the estimated y-intercept. Round your…arrow_forward
- A researcher examined the relationship between the annual tax amount paid by the construction company owners and the total expense items spent for the construction with regression analysis and calculated the regression line estimation as Y=6+2X. According to this; Write the interpretations of the cutoff and regression parameters, respectively, in your OWN SENTENCES in a statistically appropriate way over the tax amount and expenses.arrow_forwardThe table below gives the number of absences and the overall grade in the class for seven randomly selected students. Based on this data, consider the equation of the regression line, yˆ=b0+b1x�^=�0+�1�, for using the number of absences to predict a student's overall grade in the class. Keep in mind, the correlation coefficient may or may not be statistically significant for the data given. Remember, in practice, it would not be appropriate to use the regression line to make a prediction if the correlation coefficient is not statistically significant. Number of Absences Grade1 3.72 3.33 3.14 2.96 2.47 2.28 1.9arrow_forwardThe correlation between first year college GPA and high school GPA is 0.683. If a simple linear regression was conducted to predict first year college GPA from high school GPA what does the correlation tell us about the fit of the model?arrow_forward
- The following data table shows the historical data for the first semester 2020, of the amount of sales of the company "IRC", which sells sneakers. Utilizing multiple lineal regression (as shown on the image), find an equation that estimates the number of sneakers sold by the company, based on advertising and revenue. Also, determine the standard error of estimation, the coefficient of determination, and the correlation coefficient. Write down what was the quantity in thousands sold in July if the amount of ads was 8 and the income for each unit was $135arrow_forwardThe table below gives the number of hours ten randomly selected students spent studying and their corresponding midterm exam grades. Using this data, consider the equation of the regression line, yˆ=b0+b1x, for predicting the midterm exam grade that a student will earn based on the number of hours spent studying. Keep in mind, the correlation coefficient may or may not be statistically significant for the data given. Remember, in practice, it would not be appropriate to use the regression line to make a prediction if the correlation coefficient is not statistically significant. Hours Studying 0 0.5 1.5 2 2.5 3 4.5 5 5.5 6 Midterms Grades 60 63 64 69 73 76 82 90 91 95 Step 1 of 6: Find the estimated slope. Round your answer to three decimal places. Step 2 of 6: Find the estimated y-intercept. Round your answer to three decimal places. Step 3 of 6: Determine if the statement "All points predicted by the linear model fall on the same line" is true or false Step 4 of 6:…arrow_forwardThe table below gives the number of hours ten randomly selected students spent studying and their corresponding midterm exam grades. Using this data, consider the equation of the regression line, y^=b0+b1x, for predicting the midterm exam grade that a student will earn based on the number of hours spent studying. Keep in mind, the correlation coefficient may or may not be statistically significant for the data given. Remember, in practice, it would not be appropriate to use the regression line to make a prediction if the correlation coefficient is not statistically significant. Hours Studying 0 1 2 2.5 3 3.5 4 4.5 5.5 6 Midterm Grades 61 64 65 66 71 79 84 88 94 98 Summation Table x y xy x2 y2 Student 1 0.0 61 0.0 0.00 3721 Student 2 1.0 64 64.0 1.00 4096 Student 3 2.0 65 130.0 4.00 4225 Student 4 2.5 66 165.0 6.25 4356 Student 5 3.0 71 213.0 9.00 5041 Student 6 3.5 79 276.5 12.25 6241 Student 7 4.0 84 336.0 16.00 7056 Student 8 4.5 88 396.0 20.25 7744…arrow_forward
- At a .01 level of significance is there sufficient evidence to conclude that the number of books sold is related to the number of registered students in a straight-line manner, and give the regression equation.arrow_forwardThe table below gives the number of hours seven randomly selected students spent studying and their corresponding midterm exam grades. Using this data, consider the equation of the regression line, yˆ=b0+b1x�^=�0+�1�, for predicting the midterm exam grade that a student will earn based on the number of hours spent studying. Keep in mind, the correlation coefficient may or may not be statistically significant for the data given. Remember, in practice, it would not be appropriate to use the regression line to make a prediction if the correlation coefficient is not statistically significant. Hours Studying 1 2 3 3.5 4 4.5 5 Midterm Grades 60 66 73 76 78 84 90 Table Copy Data Step 1 of 6: Find the estimated slope. Round your answer to three decimal places.arrow_forwardThe table below gives the number of hours seven randomly selected students spent studying and their corresponding midterm exam grades. Using this data, consider the equation of the regression line, yˆ=b0+b1x�^=�0+�1�, for predicting the midterm exam grade that a student will earn based on the number of hours spent studying. Keep in mind, the correlation coefficient may or may not be statistically significant for the data given. Remember, in practice, it would not be appropriate to use the regression line to make a prediction if the correlation coefficient is not statistically significant. Hours Studying 11 1.51.5 2.52.5 33 44 4.54.5 55 Midterm Grades 6666 6969 7575 7979 9090 9595 9898 Find the estimated slope. Round your answer to three decimal places. Find the estimated y-intercept. Round your answer to three decimal places. Determine if the statement "Not all points predicted by the linear model fall on the same line" is true or false.…arrow_forward
 MATLAB: An Introduction with ApplicationsStatisticsISBN:9781119256830Author:Amos GilatPublisher:John Wiley & Sons Inc
 Probability and Statistics for Engineering and th...StatisticsISBN:9781305251809Author:Jay L. DevorePublisher:Cengage Learning
 Statistics for The Behavioral Sciences (MindTap C...StatisticsISBN:9781305504912Author:Frederick J Gravetter, Larry B. WallnauPublisher:Cengage Learning
 Elementary Statistics: Picturing the World (7th E...StatisticsISBN:9780134683416Author:Ron Larson, Betsy FarberPublisher:PEARSON
 The Basic Practice of StatisticsStatisticsISBN:9781319042578Author:David S. Moore, William I. Notz, Michael A. FlignerPublisher:W. H. Freeman
 Introduction to the Practice of StatisticsStatisticsISBN:9781319013387Author:David S. Moore, George P. McCabe, Bruce A. CraigPublisher:W. H. Freeman