
Essentials Of Statistics For Business & Economics
9th Edition
ISBN: 9780357045435
Author: David R. Anderson, Dennis J. Sweeney, Thomas A. Williams, Jeffrey D. Camm, James J. Cochran
Publisher: South-Western College Pub
expand_more
expand_more
format_list_bulleted
Concept explainers
Videos
Textbook Question
Chapter 14.8, Problem 47E
Restaurant Advertising and Revenue. Data on advertising expenditures and revenue (in thousands of dollars) for the Four Seasons Restaurant follow.
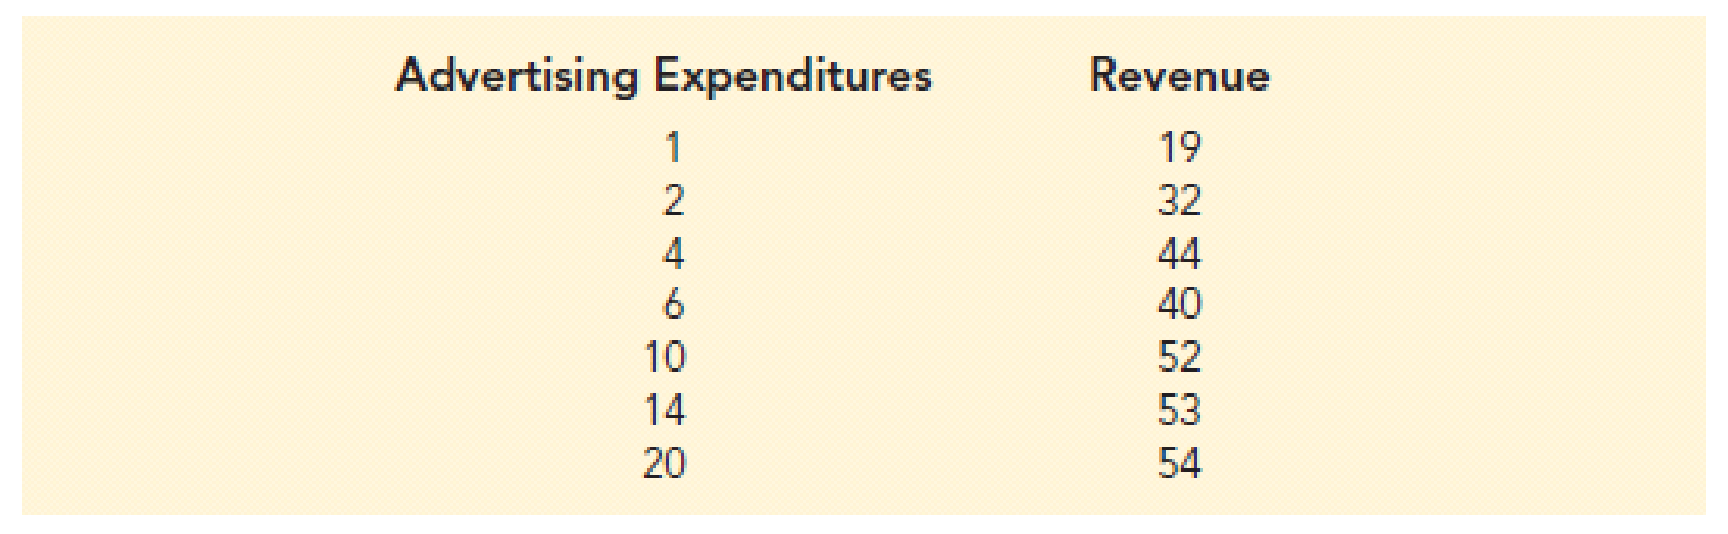
- a. Let x equal advertising expenditures and y equal revenue. Use the method of least squares to develop a straight line approximation of the relationship between the two variables.
- b. Test whether revenue and advertising expenditures are related at a .05 level of significance.
- c. Prepare a residual plot of y −
- d. What conclusions can you draw from residual analysis? Should this model be used, or should we look for a better one?
Expert Solution & Answer
Want to see the full answer?
Check out a sample textbook solution
Students have asked these similar questions
A representative sample of 190 students resulted in a regression equation between y = left hand spans (cm) and x = right hand spans (cm).
The least squares regression equation is y = 1.4 + 0.97 x.
For a student with a right and left hand span of 24 cm, what is the value of the residual? Give your answer to 2 decimal places.
(a) Compute the least-squares regression line for predicting U.S, emissions from non-U.S. emissions.
Round the slope and y-intercept values to four decimal places.
Compute the least-squares regression line for predicting the right foot temperature from the left foot temperature. Round
the slope and y-Intercept values to four decimal places.
Chapter 14 Solutions
Essentials Of Statistics For Business & Economics
Ch. 14.2 - Given are five observations for two variables, x...Ch. 14.2 - Given are five observations for two variables, x...Ch. 14.2 - Given are five observations collected in a...Ch. 14.2 - Retail and Trade: Female Managers. The following...Ch. 14.2 - Production Line Speed and Quality Control. Brawdy...Ch. 14.2 - The National Football League (NFL) records a...Ch. 14.2 - Sales Experience and Performance. A sales manager...Ch. 14.2 - Broker Satisfaction. The American Association of...Ch. 14.2 - Estimating Landscaping Expenditures. David’s...Ch. 14.2 - Age and the Price of Wine. For a particular red...
Ch. 14.2 - Laptop Ratings. To help consumers in purchasing a...Ch. 14.2 - Stock Beta. In June of 2016, Yahoo Finance...Ch. 14.2 - Auditing Itemized Tax Deductions. To the Internal...Ch. 14.2 - Distance and Absenteeism. A large city hospital...Ch. 14.3 - 15. The data from exercise 1...Ch. 14.3 - Prob. 16ECh. 14.3 - The data from exercise 3 follow.
The estimated...Ch. 14.3 - Price and Quality of Headphones. The following...Ch. 14.3 - Prob. 19ECh. 14.3 - Price and Weight of Bicycles. Bicycling, the...Ch. 14.3 - Cost Estimation. An important application of...Ch. 14.3 - Prob. 22ECh. 14.5 - The data from exercise 1 follow.
Compute the mean...Ch. 14.5 - The data from exercise 2 follow.
Compute the mean...Ch. 14.5 - The data from exercise 3 follow.
What is the...Ch. 14.5 - Headphones Conclusion. In exercise 18, the data on...Ch. 14.5 - College CPA and Salary. Do students with higher...Ch. 14.5 - Broker Satisfaction Conclusion. In exercise 8,...Ch. 14.5 - Cost Estimation Conclusion. Refer to exercise 21,...Ch. 14.5 - Significance of Fleet Size on Rental Car Revenue....Ch. 14.5 - Significance of Racing Bike Weight on Price. In...Ch. 14.6 - The data from exercise 1 follow. xi 1 2 3 4 5 yi 3...Ch. 14.6 - Prob. 33ECh. 14.6 - 34. The data from exercise 3...Ch. 14.6 - Restaurant Lines. Many small restaurants in...Ch. 14.6 - 36. In exercise 7, the data on y = annual sales ($...Ch. 14.6 - In exercise 13, data were given on the adjusted...Ch. 14.6 - Prob. 38ECh. 14.6 - Entertainment Spend. The Wall Street Journal asked...Ch. 14.7 - Apartment Selling Price. The commercial division...Ch. 14.7 - Computer Maintenance. Following is a portion of...Ch. 14.7 - Annual Sales and Salesforce. A regression model...Ch. 14.7 - Estimating Setup Time. Sherry is a production...Ch. 14.7 - Auto Racing Helmet. Automobile racing,...Ch. 14.8 - Given are data for two variables, x and y. a....Ch. 14.8 - Prob. 46ECh. 14.8 - Restaurant Advertising and Revenue. Data on...Ch. 14.8 - Experience and Sales. Refer to exercise 7, where...Ch. 14.8 - Buy Versus Rent. Occasionally, it has been the...Ch. 14.9 - Consider the following data for two variables, x...Ch. 14.9 - Consider the following data for two variables, x...Ch. 14.9 - Predicting Charity Expenses. Charity Navigator is...Ch. 14.9 - Supermarket Checkout Lines. Retail chain Kroger...Ch. 14.9 - Valuation of a Major League Baseball Team. The...Ch. 14 - 55. Does a high value of r2 imply that two...Ch. 14 - Prob. 56SECh. 14 - What is the purpose of testing whether 1 = 0? If...Ch. 14 - Stock Market Performance. The Dow Jones Industrial...Ch. 14 - Home Sire and Price. Is the number of square feet...Ch. 14 - Online Education. One of the biggest changes in...Ch. 14 - Machine Maintenance. Jensen Tire & Auto is in the...Ch. 14 - Production Rate and Quality Control. In a...Ch. 14 - Absenteeism and Location. A sociologist was hired...Ch. 14 - Bus Maintenance. The regional transit authority...Ch. 14 - Studying and Grades. A marketing professor at...Ch. 14 - Market Beta. Market betas for individual stocks...Ch. 14 - Income and Percent Audited. The Transactional...Ch. 14 - Used Car Mileage and Price. The Toyota Camry is...Ch. 14 - One measure of the risk or volatility of an...Ch. 14 - As part of a study on transportation safety, the...Ch. 14 - Consumer Reports tested 166 different...Ch. 14 - When trying to decide what car to buy, real value...Ch. 14 - Buckeye Creek Amusement Park is open from the...
Knowledge Booster


Learn more about
Need a deep-dive on the concept behind this application? Look no further. Learn more about this topic, statistics and related others by exploring similar questions and additional content below.Similar questions
- The line of best fit is the line that minimizes the total of all the squared residuals true or false?arrow_forwardA chemical engineer discovered that by adding different amounts of an additive to gasoline, he could reduce the amount of nitrous oxides (NOx) from a car engine. A specified amount was added to one gallon of gasoline and the total amount of NOx in the exhaust was collected. Assume, in suitable units, that the data is: amount of additive 1 2 3 4 5 Nox 19 17 14 13 12 a) Obtain the least squares fit, of a straight line, for the amount of NOx b) Test whether or not the slope is β = 0. Consider a significance level of 0.01. c) Provide a 99% confidence interval for the mean value of NOx when the amount of additive is 9.arrow_forwardUse the general equation for the least square regression line to show that this line always passes through the point (x,y) * bars above the x and y.That is, set x=x(with a bar above the x) and show that the line predicts that y=y (with a bar above the y).arrow_forward
- A study was conducted to assess the relationship between students’s score in final exam (y) and number of hours spent for exam (x) in each day. Data on a random sample 20 students were obtained and a regression model was estimated; and the least squares estimates obtained are: intercept a=28.5 and slope b=4.3 with SE(b)=Sb=0.017. The SS are: TSS=2540 and ESS=850. ****** QA) What is the difference between exam score obtained by two students one who studied 5 hours and the other who studied 9 hours per day. QB) In the above Question 1, find 95% CI for the slope and interpret it. In the above Question 1, find and interpret the coefficient of determination (r-square value).arrow_forwardAn owner of a home in the Midwest installed solar panels to reduce heating costs. After installing the solar panels, he measured the amount of natural gas used y (in cubic feet) to heat the home and outside temperature x (in degree-days, where a day's degree-days are the number of degrees its average temperature falls below 65° F) over a 23-month period. He then computed the least-squares regression line for predicting y from x and found it to be ŷ = 85 + 16x. The software used to compute the least-squares regression line for the equation above says that r2 = 0.98. This suggests which of the following? 1. Gas used increases by square root of 0.98 = 0.99 cubic feet for each additional degree-day? 2. Although degree-days and gas used are correlated, degree-days do not predict gas used very accurately. 3. Prediction of gas used from degree-days will be quite accurate.arrow_forwardA group of 13 healthy children and adolescents participated in a phycological study designed to analyze the relationship between age and average total sleep time (ATST). To obtain a measure for ATST (in minutes), recordings were taken on each subject on three consecutive nights and then averaged. Results are provided to you in Sleep&Age.xlsx Download Sleep&Age.xlsx file. (2 points) Determine the least-squares regression line for predicting average total sleep time using age. (2 points) Make a scatter plot of the data with ATST on the y-axis (vertical axis) and Age on the x-axis (horizontal axis) with least squares regression line overlaid on the top (i.e.: obtain the fitted line plot). Make sure to attach the plot below. (7 points) Check the assumptions for the simple linear regression. Attach any plots you used check the assumptions and comment on them. (7 points) We want to see if the average sleep time decreases as the children grow older. Write the appropriate null and…arrow_forward
- Draw a scatterplot of the right foot temperature (y) versus the left foot temperature (x). Then draw the least-squares regression line on the graph.arrow_forwardThe weight (in pounds) and height (in inches) for a child were measured every few months over a two-year period. The results are displayed in the scatterplot. The equation ŷ = 17.4 + 0.5x is called the least-squares regression line because it is least able to make accurate predictions for the data. makes the strongest association between weight and height. minimizes the sum of the squared distances from the actual y-value to the predicted y-value. maximizes the sum of the squared distances from the actual y-value to the predicted y-value.arrow_forwardGive the data: Y. 12,14, 15, 17,18, 15,16 X1. 8,8,6,5,3, 4,7 X2. 0,1,1,2, 3,3,4 Obtain the least square estimates of the parameters in the multiple regression model and test the over all significance using Anova.arrow_forward
- Researchers record the fuel consumption of a car y (in miles per gallon) at various speeds x (in miles per hour). Using software, they determine that the least-squares regression line of their data is y^=70.243−0.329x If the observed fuel consumption of the car was y = 49y=49 mpg while moving at a speed of x = 20x=20mph, what would be the error (i.e., residual) in the predicted fuel consumption at this speed found with the least-squares regression line? (Do not round your answer.)arrow_forwardA trucking company considered a multiple regression model for relating the dependent variable of total daily travel time for one of its drivers (hours) to the predictors distance traveled (miles) and the number of deliveries of made. After taking a random sample, a multiple regression was performed and the output is given below. Interpret the slope of the deliveries variable. When deliveries increases by 0.805 units, time increases by 1 hour, holding all other variables constant. 2) We do not have enough information to say. 3) When deliveries increases by 1 unit, time decreases by 0.805 hours, holding all other variables constant. 4) When deliveries decreases by 1 unit, time increases by 0.805 hours, holding all other variables constant. 5) When deliveries increases by 1 unit, time increases by 0.805 hours, holding all other variables constant.arrow_forwardA scientific foundation wanted to evaluate the relation between y= salary of researcher (in thousands of dollars), x1= number of years of experience, x2= an index of publication quality, x3=sex (M=1, F=0) and x4= an index of success in obtaining grant support. A sample of 35 randomly selected researchers was used to fit the multiple regression model. Parts of the computer output appear below. The least squares line fitted to the data is: salary = 2.001 + 0.33 x1 + 0.04 x2 + 0.69 x3 + 0.30 x4 + ε salary = 17.85 + 1.10 x1 + 0.32 x2 + 1.59 x3 + 1.29 x4 + ε salary = 2.001 + 0.33 x1 + 0.04 x2 + 0.69 x3 + 0.30 x4 salary = 17.85 + 1.10 x1 + 0.32 x2 + 1.59 x3 + 1.29 x4arrow_forward
arrow_back_ios
SEE MORE QUESTIONS
arrow_forward_ios
Recommended textbooks for you
 MATLAB: An Introduction with ApplicationsStatisticsISBN:9781119256830Author:Amos GilatPublisher:John Wiley & Sons Inc
 Probability and Statistics for Engineering and th...StatisticsISBN:9781305251809Author:Jay L. DevorePublisher:Cengage Learning
 Statistics for The Behavioral Sciences (MindTap C...StatisticsISBN:9781305504912Author:Frederick J Gravetter, Larry B. WallnauPublisher:Cengage Learning
 Elementary Statistics: Picturing the World (7th E...StatisticsISBN:9780134683416Author:Ron Larson, Betsy FarberPublisher:PEARSON
 The Basic Practice of StatisticsStatisticsISBN:9781319042578Author:David S. Moore, William I. Notz, Michael A. FlignerPublisher:W. H. Freeman
 Introduction to the Practice of StatisticsStatisticsISBN:9781319013387Author:David S. Moore, George P. McCabe, Bruce A. CraigPublisher:W. H. Freeman
MATLAB: An Introduction with Applications
Statistics
ISBN:9781119256830
Author:Amos Gilat
Publisher:John Wiley & Sons Inc
Probability and Statistics for Engineering and th...
Statistics
ISBN:9781305251809
Author:Jay L. Devore
Publisher:Cengage Learning
Statistics for The Behavioral Sciences (MindTap C...
Statistics
ISBN:9781305504912
Author:Frederick J Gravetter, Larry B. Wallnau
Publisher:Cengage Learning
Elementary Statistics: Picturing the World (7th E...
Statistics
ISBN:9780134683416
Author:Ron Larson, Betsy Farber
Publisher:PEARSON
The Basic Practice of Statistics
Statistics
ISBN:9781319042578
Author:David S. Moore, William I. Notz, Michael A. Fligner
Publisher:W. H. Freeman
Introduction to the Practice of Statistics
Statistics
ISBN:9781319013387
Author:David S. Moore, George P. McCabe, Bruce A. Craig
Publisher:W. H. Freeman
Correlation Vs Regression: Difference Between them with definition & Comparison Chart; Author: Key Differences;https://www.youtube.com/watch?v=Ou2QGSJVd0U;License: Standard YouTube License, CC-BY
Correlation and Regression: Concepts with Illustrative examples; Author: LEARN & APPLY : Lean and Six Sigma;https://www.youtube.com/watch?v=xTpHD5WLuoA;License: Standard YouTube License, CC-BY