
Essentials of Statistics for The Behavioral Sciences (MindTap Course List)
9th Edition
ISBN: 9781337098120
Author: Frederick J Gravetter, Larry B. Wallnau, Lori-Ann B. Forzano
Publisher: Cengage Learning
expand_more
expand_more
format_list_bulleted
Concept explainers
Videos
Textbook Question
Chapter 15, Problem 16P
Gender differences in dream content are well documented (see Winget & Kramer, 1979). Suppose a researcher studies aggression content in the dreams of men and women. Each participant reports his or her most recent dream. Then each dream is judged by a panel of experts to have low, medium, or high aggression content. The observed frequencies are shown in the following matrix:
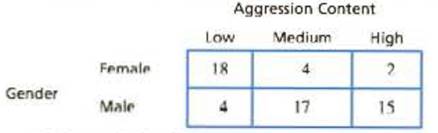
Is there a relationship between gender and the aggression content of dreams? Test with α =.01.
Expert Solution & Answer

Trending nowThis is a popular solution!

Students have asked these similar questions
The following matrix shows the bivariate correlations for houses with garages.
Baths
Beds
Sqft
Age
Price
Baths
1
Beds
0.591
1
Sqft
0.696
0.626
1
Age
-0.427
-0.133
-0.069
1
Price
0.643
0.374
0.767
-0.099
1
Baths: # of bathrooms in the house
Beds: # of bedrooms in the house
Sqft: # of square feet in the house
Age: age of the house in years
Price: selling price of house
Answer the following:
a) Do older houses with garages sell for lower or higher prices than newer houses with garages on average?
Are older houses with garages smaller or larger than newer houses with garages on average?
b) Is the correlation between baths and age weaker or stronger than correlation between beds and price?
c) Is the correlation between age and sqft weaker or stronger than the correlation between age and price?
1
Professor Yema conducted a research to determine factors that influence environmental attitude. Table 1 below is a matrix of Pearson’s r correlation coefficients for the following variables used in the study: Environmental attitude (En), level of education (Le), and income (In).
Table 1: Factors that influence environmental attitude
____________________________________________________________________
Variable En Le In
____________________________________________________________________
Environmental attitude (En) 1.0
Level of education (Le) 0.6** 1.0
Income (In) –0.3* 0.9*** 1.0
____________________________________________________________________
***Correlation is…
The following is the correlation matrix.
SALES
GENDER
OWNHOME
MARRIED
INCOME
CHILDREN
CATALOGS
SALES
1.0000
GENDER
0.1950
1.0000
OWNHOME
0.3480
0.0844
1.0000
MARRIED
0.4711
0.1161
0.2640
1.0000
INCOME
0.6845
0.2583
0.4494
0.6652
1.0000
CHILDREN
-0.2248
-0.1055
-0.0323
0.0098
0.0479
1.0000
CATALOGS
0.4664
0.0874
0.0931
0.1371
0.1779
-0.1135
1.0000
The regression equation is: estimated SALES = 247.0745 + 78.6075*CATALOGS
question:
What is the slope coefficient for the regression equation?
Chapter 15 Solutions
Essentials of Statistics for The Behavioral Sciences (MindTap Course List)
Ch. 15.1 - Which of the following is a characteristic of...Ch. 15.1 - Which of the following accurately describes the...Ch. 15.1 - A researcher uses a sample of n = 60 participants...Ch. 15.2 - Prob. 1LCCh. 15.2 - Prob. 2LCCh. 15.2 - A researcher uses a sample of 20 college...Ch. 15.3 - If a chi-square test for independence has df 3,...Ch. 15.3 - Prob. 2LCCh. 15.3 - Prob. 3LCCh. 15.4 - Prob. 1LC
Ch. 15.4 - A researcher obtains X2 = 4.0 for a test for...Ch. 15.4 - Under what circumstances should the chi-square...Ch. 15.5 - Prob. 1LCCh. 15.5 - Prob. 2LCCh. 15 - Prob. 1PCh. 15 - The student population at the state college...Ch. 15 - A developmental psychologist would like to deter...Ch. 15 - Data from the Department of Motor Vehicles...Ch. 15 - A psychologist examining art appreciation selected...Ch. 15 - A professor in the psychology department would...Ch. 15 - Automobile insurance is much more expensive for...Ch. 15 - A communications company has developed three new...Ch. 15 - Prob. 9PCh. 15 - Earlier in the chapter, we introduced the...Ch. 15 - Liu el al. (2015) recently reported the results of...Ch. 15 - Many businesses use some type of customer loyalty...Ch. 15 - In a classic study, Loftus and Palmer (1974)...Ch. 15 - In a study investigating freshman weight pain, the...Ch. 15 - Research results suggest that IQ scores for boys...Ch. 15 - Gender differences in dream content are well...Ch. 15 - Many parents allow their underage children to...Ch. 15 - A recent study indicates that people tend to...Ch. 15 - Research indicates that people who volunteer to...Ch. 15 - Research has demonstrated strong gender...
Knowledge Booster


Learn more about
Need a deep-dive on the concept behind this application? Look no further. Learn more about this topic, statistics and related others by exploring similar questions and additional content below.Similar questions
- For the data in the following matrix: No Treatment Treatment Male 8 3 Overall M = 5.5 Female 4 4 Overall M = 4 Overall M = 6 Overall M = 3.5 Which two means are compared to determine whether there is a main effect of treatment? Is there a treatment by gender interaction? Do the effects of treatment on the scores depend on the levels of gender( do the effects of treatment on the scores are different in males and females? If so, explain the interaction, include the corresponding means in your explanation.arrow_forwardWhen constructing a correlation matrix table in APA style, what are the criteria for deciding whether to place zero, one, two, or three asterisks next to the correlation coefficient?arrow_forwardQuestion 18 A researcher reported the following covariance matrix for her 3-item (7-option Likert item responses) test. Item1 Item2 Item3 Item4 Item1 3.84 2.63 1.89 2.14 Item2 2.63 3.62 2.10 2.25 Item3 1.89 2.10 3.68 2.52 Item4 2.14 2.25 2.52 3.80 What is the value of coefficient alpha? Question 19 In which of the following test assumptions is coefficient alpha NOT equal to reliability?arrow_forward
- How to interpret the following correlation matrix X1 X2 X3 X4X1 1 X2 -0.026651075 1 X3 -0.251215273 0.478429673 1 X4 0.009303729 0.185917439 -0.126481433 1arrow_forwardRefer to the Baseball 2018 data given below, which report information on the 30 Major League Baseball teams for the 2018 season. Let the number of games won be the dependent variable and the following variables be independent variables: team batting average, team earned run average (ERA), number of home runs and whether the team plays in the American or National league (American League is 1 and National League is 0). a. Develop a correlation matrix. (i) Which independent variables have strong or weak correlations with the dependent variable. (ii) Do you see any problems with multicollinearity? Explain your answer. b. Use Excel to determine the multiple regression equation. (i) Write out the regression equation and determine its practical application (i.e., interpret the equation). (ii) Report and interpret the R-square. c. Conduct a global test on the set of independent variables. Interpret. d. Conduct a test of hypothesis on each of the independent variables. Would…arrow_forwardRefer to the Baseball 2018 data given below, which report information on the 30 Major League Baseball teams for the 2018 season. Let the number of games won be the dependent variable and the following variables be independent variables: team batting average, team earned run average (ERA), number of home runs and whether the team plays in the American or National league (American League is 1 and National League is 0). a. Develop a correlation matrix. (i) Which independent variables have strong or weak correlations with the dependent variable. (ii) Do you see any problems with multicollinearity? Explain your answer. b. Use Excel to determine the multiple regression equation. (i) Write out the regression equation and determine its practical application (i.e., interpret the equation). (ii) Report and interpret the R-square. c. Conduct a global test on the set of independent variables. Interpret. d. Conduct a test of hypothesis on each of the independent variables. Would…arrow_forward
- The correlation coefficient, r, developed by Karl Pearson in the early 1900s, is numerical and provides a measure of strength and direction of the linear association between the independent variable x and the dependent variable y. Group of answer choices True Falsearrow_forwardA paper investigated the driving behavior of teenagers by observing their vehicles as they left a high school parking lot and then again at a site approximately 1 2 mile from the school. Assume that it is reasonable to regard the teen drivers in this study as representative of the population of teen drivers. MaleDriver FemaleDriver 1.3 -0.3 1.3 0.6 0.9 1.1 2.1 0.7 0.7 1.1 1.3 1.2 3 0.1 1.3 0.9 0.6 0.5 2.1 0.5 (a) Use a .01 level of significance for any hypothesis tests. Data consistent with summary quantities appearing in the paper are given in the table. The measurements represent the difference between the observed vehicle speed and the posted speed limit (in miles per hour) for a sample of male teenage drivers and a sample of female teenage drivers. (Use ?males − ?females. Round your test statistic to two decimal places. Round your degrees of freedom down to the nearest whole number. Round your p-value to three decimal places.) t = df =…arrow_forwardA paper investigated the driving behavior of teenagers by observing their vehicles as they left a high school parking lot and then again at a site approximately 1 2 mile from the school. Assume that it is reasonable to regard the teen drivers in this study as representative of the population of teen drivers. MaleDriver FemaleDriver 1.4 -0.2 1.2 0.5 0.9 1.1 2.1 0.7 0.7 1.1 1.3 1.2 3 0.1 1.3 0.9 0.6 0.5 2.1 0.5 (a) Use a .01 level of significance for any hypothesis tests. Data consistent with summary quantities appearing in the paper are given in the table. The measurements represent the difference between the observed vehicle speed and the posted speed limit (in miles per hour) for a sample of male teenage drivers and a sample of female teenage drivers. (Use ?males − ?females. Round your test statistic to two decimal places. Round your degrees of freedom down to the nearest whole number. Round your p-value to three decimal places.) t = df =…arrow_forward
- Most sports injuries are immediate and obvious, like a broken leg. However, some can be more subtle, like the neurological damage that may occur when soccer players repeatedly head a soccer ball. To examine long-term effects of repeated heading, Downs and Abwender (2002) examined two different age groups of soccer players and swimmers. The dependent variable was performance on a conceptual thinking task. Following is a hypothetical ANOVA table and matrix of means, similar to the research results. College Older Soccer M = 9 M = 4 Swimming M = 9 M = 8 Describe the results of this study (each main effect and interaction). State the statistics (just the #’s) as they would appear in a research report (each main effect and interaction).arrow_forwardA research team studied the relationships between income, education, age, and IQ in a sample of n = 30 individuals. The matrix shown below shows values for Pearson's r for the study with α=.05α=.05 Education Age IQ Income +.58 +.38 +.27 Education - +.11 +.39 Age - +.02 a) What are the degrees of freedom for the bivariate correlation between income and education? b) Is the correlation between income and education significant? Explain. Hint: Do not calculate t. Instead, refer to the table. c) Write the appropriate statement to express the result for the correlation between income and education.arrow_forwardIf a researcher randomly assigns participants to one of two conditions, that researcher is likely to use a(n): a. correlational design b. quasi-experimental design c. experimental design d. descriptive designarrow_forward
arrow_back_ios
SEE MORE QUESTIONS
arrow_forward_ios
Recommended textbooks for you
 Linear Algebra: A Modern IntroductionAlgebraISBN:9781285463247Author:David PoolePublisher:Cengage Learning
Linear Algebra: A Modern Introduction
Algebra
ISBN:9781285463247
Author:David Poole
Publisher:Cengage Learning
Correlation Vs Regression: Difference Between them with definition & Comparison Chart; Author: Key Differences;https://www.youtube.com/watch?v=Ou2QGSJVd0U;License: Standard YouTube License, CC-BY
Correlation and Regression: Concepts with Illustrative examples; Author: LEARN & APPLY : Lean and Six Sigma;https://www.youtube.com/watch?v=xTpHD5WLuoA;License: Standard YouTube License, CC-BY