
Videos
The article “Effects of a Rice-Rich Versus Potato-Rich Diet on Glucose, Lipoprotein, and Cholesterol Metabolism in Noninsulin-Dependent Diabetics” (Anter. J. of Clinical Nutr., 1984: 598-606) gives the accompanying data on cholcsterol-synthesis rate for eight diabetic subjects. Subjects were fed a standardized diet with potato or rice as the major carbohydrate source. Participants received both diets for specified periods of time, with cholesterol-synthesis rate (mmol/day) measured at the end of each dietary period. The analysis presented in this article used a distribution-free test. Use such a test with significance level .05 to determine whether the true mean cholesterol-synthesis rate differs significantly for the two sources of carbohydrates.
| Cholesterol-Synthesis Rate | ||||||||
| Subject | 1 | 2 | 3 | 4 | 5 | 6 | 7 | 8 |
| Potato | 1.88 | 2.60 | 1.38 | 4.41 | 1.87 | 2.89 | 3.96 | 2.31 |
| Rice | 1.70 | 3.84 | 1.13 | 4.97 | .86 | 1.93 | 3.36 | 2.15 |
Test whether the true mean cholesterol-synthesis rate differs for the two sources of carbohydrates.
Answer to Problem 28SE
There is no sufficient evidence to support that there is a difference between the cholesterol synthesis rates for the two carbohydrate source at 5% level of significance.
Explanation of Solution
Given info:
The cholesterol-synthesis rate are measured at the end of the two diets (potato and rice) are measured for participants. Each participant had received both diets for different period. The level of significance is 0.05.
Calculation:
Conditions for using Wilcoxon signed ranked test for paired observation:
- The difference of the paired data should be continuous
- The distribution of the difference should be symmetric.
Here, the difference of the data is continuous. For checking the symmetry boxplot can be drawn.
Software procedure:
Step by step procedure to draw the boxplot using the MINITAB software:
- Choose Graph > Boxplot.
- Choose Simple, and then click OK.
- In Graph variables, enter the corresponding column of difference.
- Click OK.
Output using the MINITAB software is given below:
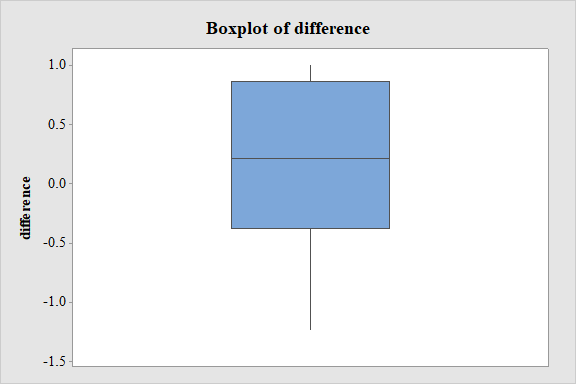
From the boxplot, it can be observes that the distribution of difference of two diets is approximately symmetric.
Hence, Wilcoxon signed ranked test can be applied.
Parameter of interest:
Let
Hypotheses:
Null hypothesis:
That is, there is no difference between cholesterol synthesis rates for the two carbohydrate source.
Alternative hypothesis:
That is, there is a difference between the cholesterol synthesis rates for the two carbohydrate source.
Test statistic:
Software procedure:
Step by step procedure to obtain the test-statistic value using the MINITAB software:
- Choose Stat >Nonparametrics> 1-Sample Wilcoxon.
- In Variables, enter the column of difference
- Choose the Test median, enter the value as 0 and select not equal in Alternative.
- Click OK.
Output using the MINITAB software is given below:
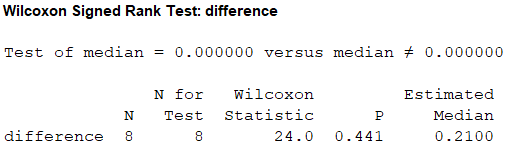
From the MINITAB output, the test statistic value is 24
P-value:
For two tailed test, the P-value is
Procedure for finding P-value from table A.13 of Appendix:
- Locate the sample size 8.
- The nearest critical value
- The corresponding value is
Hence, the P-value is more than
Decision:
If
If
Conclusion:
For
Here, the P-value is greater than the level of significance.
That is,
By rejection rule, fail to reject the null hypothesis.
Interpretation:
Thus, it can be concluded that there is no sufficient evidence to support that there is a difference between the cholesterol synthesis rates for the two carbohydrate source at 5% level of significance.
Want to see more full solutions like this?
Chapter 15 Solutions
Probability and Statistics for Engineering and the Sciences


- In its January 25, 2012, issue, the Journal of the American Medical Association reported on the effects of overconsumption of low, normal, and high protein diets on weight gain, energy expenditure, and body composition. Researchers conducted a single blind, randomized controlled trial of 25 U.S. adults. The subjects were healthy, weight-stable, male and female volunteers, aged 18 to 35 years. All subjects consumed a weight-stabilizing diet for 13 to 25 days. Afterwards, the researchers randomly assigned participants to diets containing various percentages of energy from protein: 5% (low protein), 15% (normal protein), or 25% (high protein). The subjects were not aware of the specific protein level diet to which they were assigned. On these diets the researchers overfed the participants during the last 8 weeks of their 10 to 12 week stay in the inpatient metabolic unit. The goal was to investigate the effect of overconsumption of protein on weight gain, energy expenditure, and body…arrow_forwardIn a study conducted in the Science Department of Faculty of Science, Technology and Human Development in a University; the researcher examined the influence of the drug succinylcholine on the circulation levels of androgens in the blood. Blood samples from wild, free-ranging deer were obtained via the jugular vein immediately after an intramuscular injection of succinylcholine using darts and a capture gun. Deer were bled again approximately 30 minutes after the injection and then released. The level of androgens at time of capture and 30 minutes later, measured in nanograms per milliliter (ng/ml), for 15 deers as in Table Q1. Assuming that the populations of androgen at time of injection and 30 minutes later are normally distributed:i) Find the average and standard deviation of this studyii)Determine the critical region of this problem.iii) Test at the 0.05 level of significance whether the androgen concentrations are altered after 30 minutes of restraint.arrow_forwardStressed-Out Bus Drivers. Previous studies have shown that urban bus drivers have an extremely stressful job, and a large proportion of drivers retire prematurely with disabilities due to occupational stress. In the paper, “Hassles on the Job: A Study of a Job Intervention With Urban Bus Drivers” (Journal of Organizational Behavior, Vol. 20, pp. 199–208), G. Evans et al. examined the effects of an intervention program to improve the conditions of urban bus drivers.Amongother variables, the researchers monitored diastolic blood pressure of bus drivers in downtown Stockholm, Sweden. The data, in millimeters of mercury (mm Hg), on the WeissStats site are based on the blood pressures obtained prior to intervention for the 41 bus drivers in the study. Use the technology of your choice to do the following. a. Obtain a normal probability plot, boxplot, histogram, and stemand-leaf diagram of the data. b. Based on your results from part (a), can you reasonably apply the one-mean t-test to the…arrow_forward
- In recent years, concerns have been expressed about adverse health effects from amalgam dental restorations, which include mercury. The table below shows results from a study in which some patients were treated with amalgam restorations and others were treated with composite restorations that do not contain mercury (based on data from “Neuropsychological and Renal Effects of Dental Amalgam in Children,” by Bellinger, et al., Journal of the American Medical Association, Vol. 295, No. 15). Use a 0.05 significance level to test for independence between the type of restoration and sensory disorders. Do amalgam restorations appear to affect sensory disorders? Amalgam Composite Sensory disorder 36 28 No sensory disorder 231 239arrow_forwardThe authors of the article “Predictive Model for PittingCorrosion in Buried Oil and Gas Pipelines”(Corrosion, 2009: 332–342) provided the data on whichtheir investigation was based.a. Consider the following sample of 61 observations onmaximum pitting depth (mm) of pipeline specimensburied in clay loam soil. 0.41 0.41 0.41 0.41 0.43 0.43 0.43 0.48 0.480.58 0.79 0.79 0.81 0.81 0.81 0.91 0.94 0.941.02 1.04 1.04 1.17 1.17 1.17 1.17 1.17 1.171.17 1.19 1.19 1.27 1.40 1.40 1.59 1.59 1.601.68 1.91 1.96 1.96 1.96 2.10 2.21 2.31 2.462.49 2.57 2.74 3.10 3.18 3.30 3.58 3.58 4.154.75 5.33 7.65 7.70 8.13 10.41 13.44Construct a stem-and-leaf display in which the twolargest values are shown in a last row labeled HI.b. Refer back to (a), and create a histogram based oneight classes with 0 as the lower limit of the firstclass and class widths of .5, .5, .5, .5, 1, 2, 5, and 5,respectively.c. The accompanying comparative boxplot fromMinitab shows plots of pitting depth for four differenttypes of soils.…arrow_forwardThe Lion’sMane. In a study by P. M.West titled “The Lion’s Mane” (American Scientist, Vol. 93, No. 3, pp. 226–236), the effects of the mane of a male lion as a signal of quality to mates and rivals was explored. Four life-sized dummies of male lions provided a tool for testing female response to the unfamiliar lions whose manes varied by length (long or short) and color (blonde or dark). The female lions were observed to see whether they approached each of the four life-sized dummies. a. experimental units. b. response variable. c. factor(s). d. levels of each factor. e. treatments.arrow_forward
- A sample of 26 offshore oil workers took part in a simulated escape exercise, resulting in the accompanying data on time (sec) to complete the escape (“Oxygen Consumption and Ventilation During Escape from an Offshore Platform,” Ergonomics, 1997: 281-292): 389 356 359 363 375 424 325 394 402 373 373 370 364 366 364 325 339 393 392 369 374 359 356 403 334 397 a. Construct a stem-and-leaf display of the data. How does it suggest that the sample mean and median will compare?b. Calculate the values of the sample mean and median. [Hint: Σxi = 9638.]c. By how much could the largest time, currently 424, be increased without affecting the value of the sample median? By how much could this value be decreased without affecting the value of the sample median?d. What are the values of x and x when the observations are reexpressed in minutes?arrow_forwardclassify as either observational or experimental design Heart Failure. In the paper “Cardiac-Resynchronization Therapy with or without an Implantable Defibrillator in Advanced Chronic Heart Failure” (New England Journal of Medicine, Vol. 350, pp. 2140–2150), M. Bristow et al. reported the results of a study of methods for treating patients who had advanced heart failure due to ischemic or nonischemic cardiomyopathies. A total of 1520 patientswere randomly assigned in a 1:2:2 ratio to receive optimal pharmacologic therapy alone or in combination with either a pacemaker or a pacemaker–defibrillator combination. The patients were thenobserved until they died or were hospitalized for any cause.arrow_forwardA team of industrial psychologists studies the emotional maturity of high school graduate and high school dropouts employed in the same type of work. The test scores shown below are result from a standardized test given to random samples of subjects selected from the two populations. High school graduates: 90 85 87 88 57 69 92 94 82 88 75 High school dropouts: 80 54 72 58 41 53 64 60 72 44 45 Perform a two independent samples Wilcoxon Rank Sum test to see if there is significant different between the population medians. Also, properly conclude your analysis by providing your comments on the findings. (The output from the statistical software should be included for supporting your comments.) Null hypothesis: Alternative hypothesis: Report the value of the Wilcoxon Rank Sum test statistic = Report p-value from the test and the conclusion: [Place your software output here.]arrow_forward
- The table below shows the numbers of bushels of barley cultivated per acre for 12 one-acre plots of land for two different strains of barley, PHT-34 and CBX-21. PHT-34 CBX-21 43 55 49 46 47 43 38 44 47 45 45 49 50 47 46 59 46 52 46 49 45 48 43 51 Determine the minimum data value, the quartiles, and the maximum data value for the PHT-34 and CBX-21 data sets. PHT-34 CBX-21 min Q1 Q2 Q3 maxarrow_forwardAn article in Knee Surgery, Sports Traumatology, Arthroscopy (2005, Vol. 13, pp. 273-279) considered arthroscopic meniscal repair with an absorbable screw. Results showed that for tears greater than 25 millimeters, 14 of 18 (78%) repairs were successful, but for shorter tears, 22 of 30 (73%) repairs were successful. A doctor would like to know if there is evidence that the success rate is greater for longer tears. The P-value for the test H0: p1 = p2 versus H1: p1 > p2 is closest to:arrow_forwardConsider the following measurements of blood hemoglobin concentrations (in g/dL) from three human populations at different geographic locations: population1 = [ 14.7 , 15.22, 15.28, 16.58, 15.10 ] population2 = [ 15.66, 15.91, 14.41, 14.73, 15.09] population3 = [ 17.12, 16.42, 16.43, 17.33] What is the standard error of the difference between the means of population 1 and population 2, needed to calculate the Tukey-Kramer q-statistic? What is the Tukey-Kramer q-statistic for populations 1 and 2? (Report the absolute value, if you get a negative number, multiply by -1)arrow_forward
 MATLAB: An Introduction with ApplicationsStatisticsISBN:9781119256830Author:Amos GilatPublisher:John Wiley & Sons Inc
 Probability and Statistics for Engineering and th...StatisticsISBN:9781305251809Author:Jay L. DevorePublisher:Cengage Learning
 Statistics for The Behavioral Sciences (MindTap C...StatisticsISBN:9781305504912Author:Frederick J Gravetter, Larry B. WallnauPublisher:Cengage Learning
 Elementary Statistics: Picturing the World (7th E...StatisticsISBN:9780134683416Author:Ron Larson, Betsy FarberPublisher:PEARSON
 The Basic Practice of StatisticsStatisticsISBN:9781319042578Author:David S. Moore, William I. Notz, Michael A. FlignerPublisher:W. H. Freeman
 Introduction to the Practice of StatisticsStatisticsISBN:9781319013387Author:David S. Moore, George P. McCabe, Bruce A. CraigPublisher:W. H. Freeman