
Concept explainers
Videos
Matt Kenseth won the 2012 Daytona 500, the most important race of the NASCAR season. His win was no surprise because for the 2011 season he finished fourth in the point standings with 2330 points, behind Tony Stewart (2403 points), Carl Edwards (2403 points), and Kevin Harvick (2345 points). In 2011 he earned $6,183,580 by winning three Poles (fastest driver in qualifying), winning three races, finishing in the top five 12 times, and finishing in the top ten 20 times. NASCAR’s point system in 2011 allocated 43 points to the driver who finished first, 42 points to the driver who finished second, and so on down to 1 point for the driver who finished in the 43rd position. In addition any driver who led a lap received 1 bonus point, the driver who led the most laps received an additional bonus point, and the race winner was awarded 3 bonus points. But, the maximum number of points a driver could earn in any race was 48. Table 15.13 shows data for the 2011 season for the top 35 drivers (NASCAR website).
Managerial Report
- 1. Suppose you wanted to predict Winnings ($) using only the number of poles won (Poles), the number of wins (Wins), the number of top five finishes (Top 5), or the number of top ten finishes (Top 10). Which of these four variables provides the best single predictor of winnings?
- 2. Develop an estimated regression equation that can be used to predict Winnings ($) given the number of poles won (Poles), the number of wins (Wins), the number of top five finishes (Top 5), and the number of top ten (Top 10) finishes. Test for individual significance and discuss your findings and conclusions.
- 3. Create two new independent variables: Top 2–5 and Top 6–10. Top 2–5 represents the number of times the driver finished between second and fifth place and Top 6–10 represents the number of times the driver finished between sixth and tenth place. Develop an estimated regression equation that can be used to predict Winnings ($) using Poles, Wins, Top 2–5, and Top 6–10. Test for individual significance and discuss your findings and conclusions.
TABLE 15.13 Nascar Results for the 2011 Season
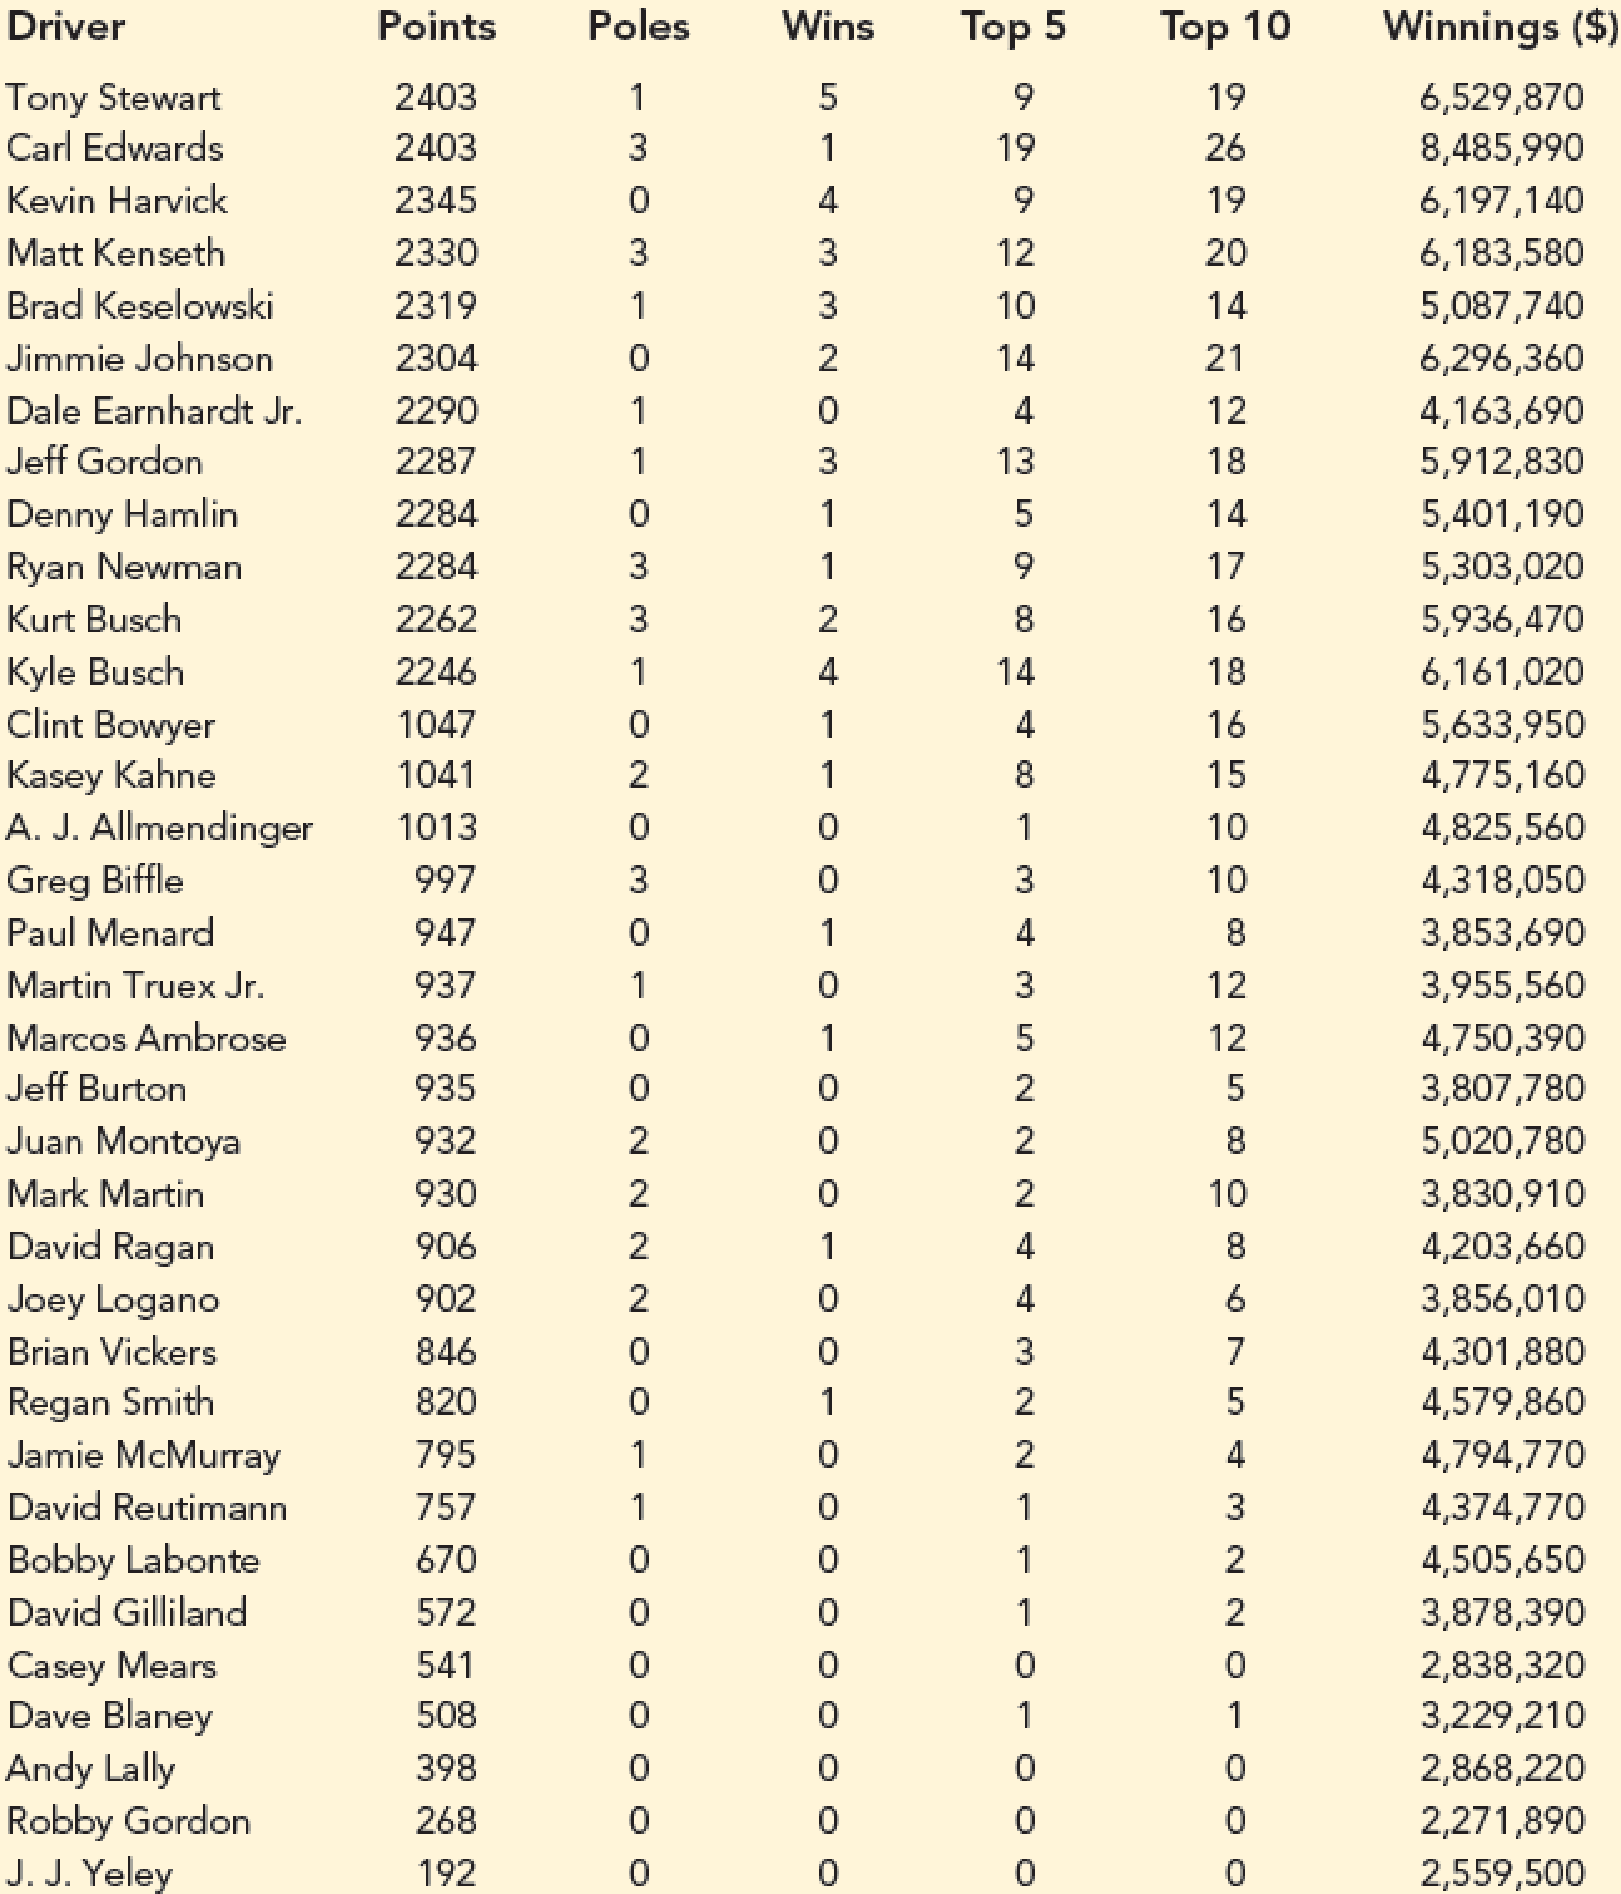
Source: NASCAR website, February 28, 2011. (https://www.nascar.com/)
- 4. Based upon the results of your analysis, what estimated regression equation would you recommend using to predict Winnings ($)? Provide an interpretation of the estimated regression coefficients for this equation.
1.
Find the best predictor of winnings.
Answer to Problem 2CP
The best predictor of winnings is top 10 finishes.
Explanation of Solution
Calculation:
The data related to the earned point, frequency of winning poles, wins, top 5 and top 10 for 35 NASCAR drivers are given. Winning money for drivers is also given.
Regression:
Software procedure:
Step-by-step procedure to obtain regression equation using EXCEL software:
- Open an EXCEL sheet and enter the data of Driver, Points, Poles, Wins, Top5, Top10 and Winnings ($) corresponding to columns A, B, C, D, E, F, and G, respectively.
- Select Data > Data Analysis > Regression.
- Click OK.
- Under Input Y Range enter $G$1:$G$36.
- Under Input X Range enter $C$1:$C$36.
- Click the box of Labels.
- Under Output Range enter $I$1.
- Click OK.
The output using EXCEL software is given as,
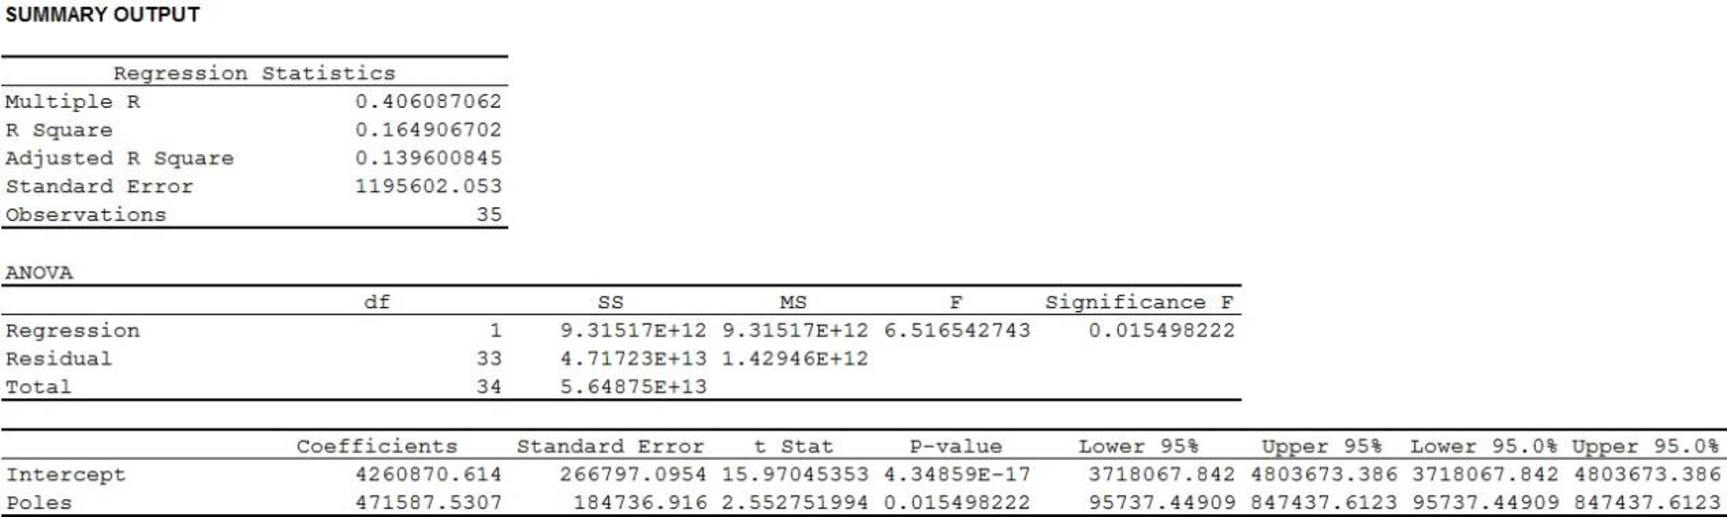
Thus, the estimated regression equation to predict the winnings using the number of poles won is approximately
The coefficient of determination (
In the output,
Thus, only 16.5% variability in winnings is explained by the variability in number of poles won.
Regression:
Software procedure:
Step-by-step procedure to obtain regression equation using EXCEL software:
- Open an EXCEL sheet and enter the data of Driver, Points, Poles, Wins, Top5, Top10 and Winnings ($) corresponding to columns A, B, C, D, E, F, and G, respectively.
- Select Data > Data Analysis > Regression.
- Click OK.
- Under Input Y Range enter $G$1:$G$36.
- Under Input X Range enter $D$1:$D$36.
- Click the box of Labels.
- Under Output Range enter $I$1.
- Click OK.
The output using EXCEL software is given as,
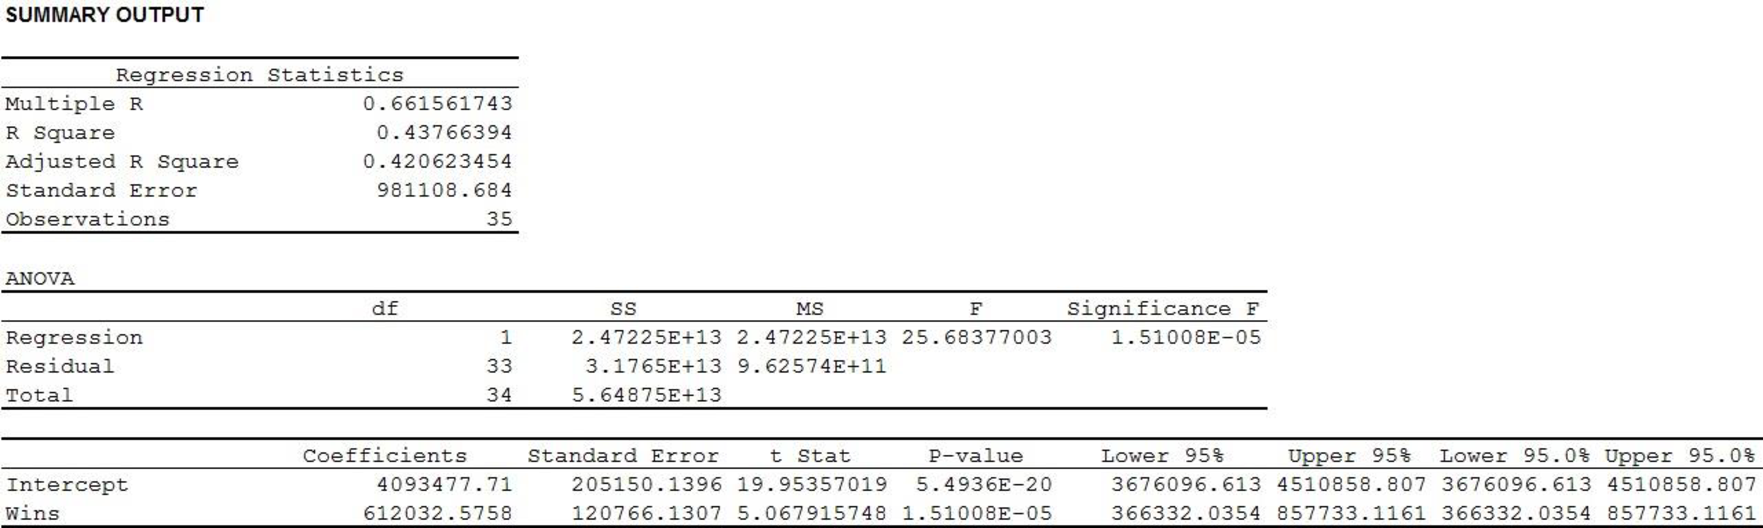
Thus, the estimated regression equation to predict the winnings using the number of wins is approximately
In the output,
Thus, only 43.8% variability in winnings is explained by the variability in number of wins.
Regression:
Software procedure:
Step-by-step procedure to obtain regression equation using EXCEL software:
- Open an EXCEL sheet and enter the data of Driver, Points, Poles, Wins, Top5, Top10 and Winnings ($) corresponding to columns A, B, C, D, E, F, and G, respectively.
- Select Data > Data Analysis > Regression.
- Click OK.
- Under Input Y Range enter $G$1:$G$36.
- Under Input X Range enter $E$1:$E$36.
- Click the box of Labels.
- Under Output Range enter $I$1.
- Click OK.
The output using EXCEL software is given as,
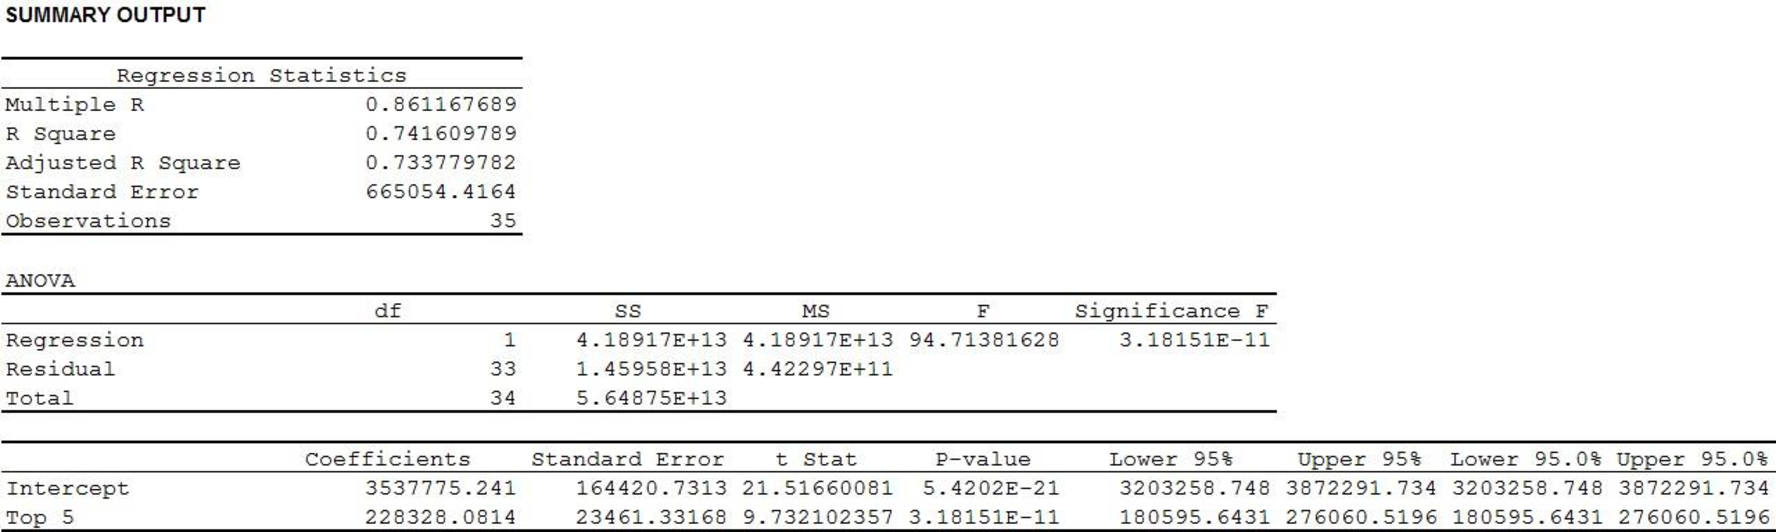
Thus, the estimated regression equation to predict the winnings using the number of top five finishes is approximately
In the output,
Thus, 74.2% variability in winnings is explained by the variability in number of top 5 finishes.
Regression:
Software procedure:
Step-by-step procedure to obtain regression equation using EXCEL software:
- Open an EXCEL sheet and enter the data of Driver, Points, Poles, Wins, Top5, Top10 and Winnings ($) corresponding to columns A, B, C, D, E, F, and G, respectively.
- Select Data > Data Analysis > Regression.
- Click OK.
- Under Input Y Range enter $G$1:$G$36.
- Under Input X Range enter $F$1:$F$36.
- Click the box of Labels.
- Under Output Range enter $I$1.
- Click OK.
The output using EXCEL software is given as,
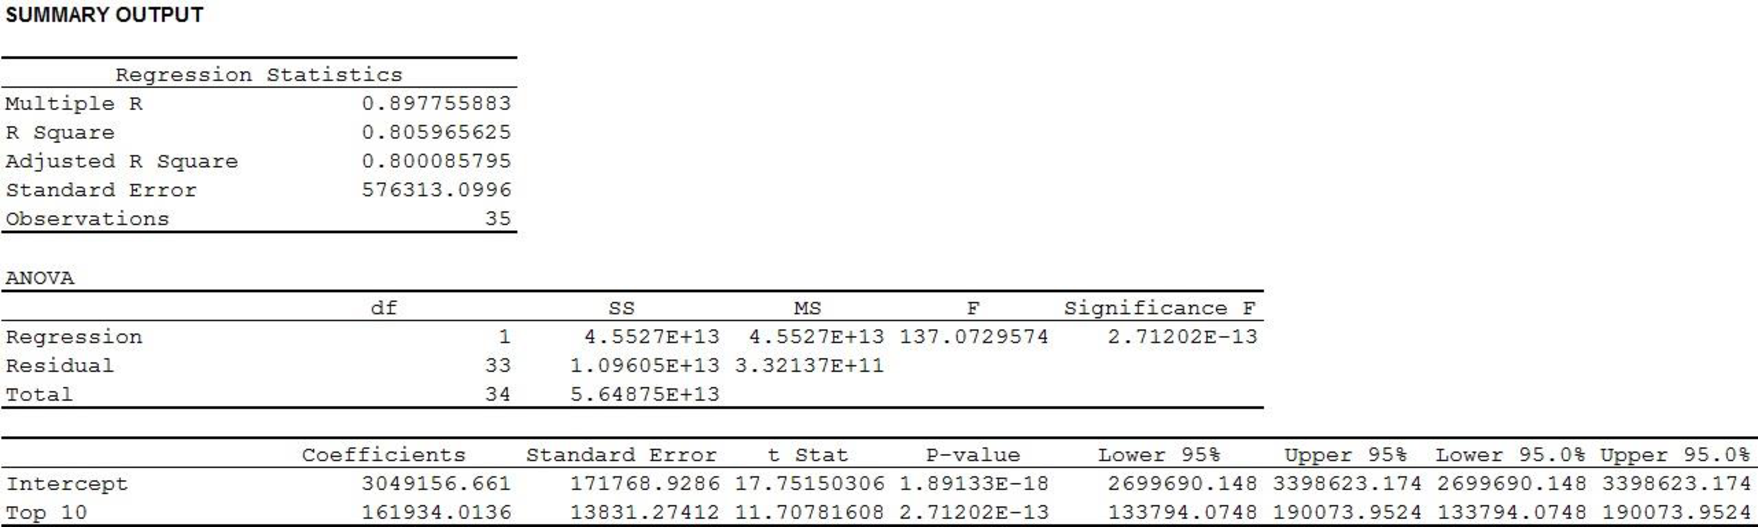
Thus, the estimated regression equation to predict the winnings using the number of top ten finishes is
In the output,
Thus, 80.6% variability in winnings is explained by the variability in number of top 10 finishes.
Hence, maximum variability in winnings is explained by using only the variability in number of top 10 finishes.
Therefore, the best predictor of winnings is top 10 finishes.
2.
Find an estimated regression equation that can be used to predict Winnings given the number of poles won (Poles), the number of wins (Wins), the number of top five finishes (Top 5) and the number of top ten finishes (Top 10).
Test for individual significance and draw conclusions.
Explain about the results.
Answer to Problem 2CP
The estimated regression equation that can be used to predict Winnings given the number of poles won (Poles), the number of wins (Wins), the number of top five finishes (Top 5) and the number of top ten finishes (Top 10) is
The ‘Top 10’ variable is significant to predict winnings
Explanation of Solution
Calculation:
In the given problem winnings be the dependent variable (y), and Poles (
Regression:
Software procedure:
Step by step procedure to obtain regression equation using EXCEL software is given as,
- Open an EXCEL sheet and enter the data of Driver, Points, Poles, Wins, Top5, Top10 and Winnings ($) corresponding to columns A, B, C, D, E, F, and G, respectively.
- Select Data > Data Analysis > Regression.
- Click OK.
- Under Input Y Range enter $G$1:$G$36.
- Under Input X Range enter $C$1:$F$36.
- Click the box of Labels.
- Under Output Range enter $I$1.
- Click OK.
The output using EXCEL software is given as,
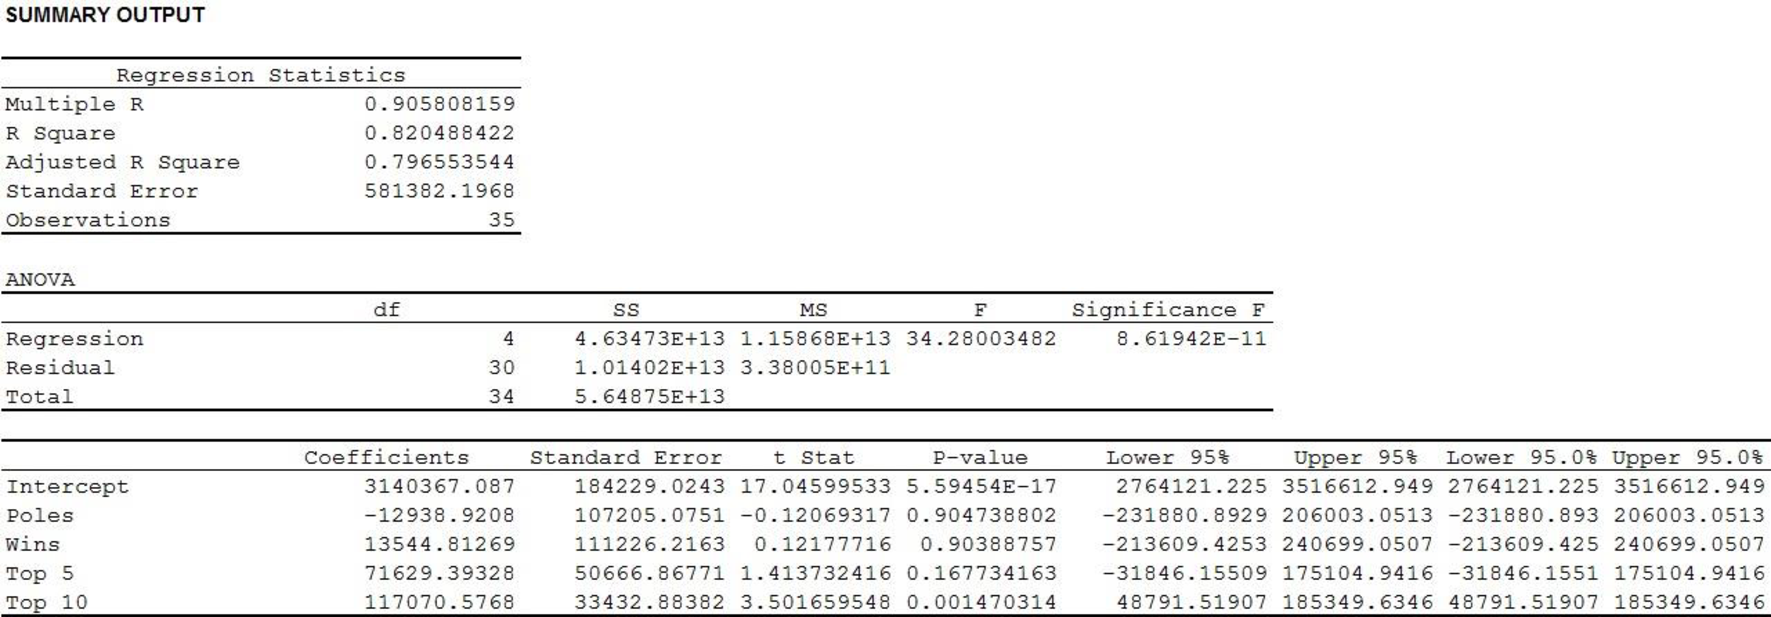
Thus, the estimated regression equation that can be used to predict Winnings given the number of poles won (Poles), the number of wins (Wins), the number of top five finishes (Top 5) and the number of top ten finishes (Top 10) is
State the test hypotheses.
Null hypothesis:
That is, there is not a significant relationship between winnings and poles.
Alternative hypothesis:
That is, there is a significant relationship between winnings and poles.
From the output it is found that the t statistic corresponding to poles is –0.12 with df of 30 and the p value for t statistic corresponding to poles is 0.905.
Level of significance:
Assume the level of significance is
Rejection rule:
- If the
- Otherwise, failed to reject the null hypothesis.
Conclusion:
Here, the p-value is greater than the level of significance.
That is,
Thus, the decision is “fail to reject the null hypothesis”.
Therefore, the data do not provide sufficient evidence to conclude there is a significant relationship between winnings and poles.
State the test hypotheses.
Null hypothesis:
That is, there is not a significant relationship between winnings and wins.
Alternative hypothesis:
That is, there is a significant relationship between winnings and wins.
From the output it is found that the t statistic corresponding to wins is 0.12 with df of 30 and the p value for t statistic corresponding to poles is 0.904.
Conclusion:
Here, the p-value is greater than the level of significance.
That is,
Thus, the decision is “fail to reject the null hypothesis”.
Therefore, the data do not provide sufficient evidence to conclude there is a significant relationship between winnings and wins.
State the test hypotheses.
Null hypothesis:
That is, there is not a significant relationship between winnings and Top 5.
Alternative hypothesis:
That is, there is a significant relationship between winnings and Top 5.
From the output, it is found that the t statistic corresponding to Top 5 is 1.41 with df of 30 and the p value for t statistic corresponding to poles is 0.168.
Conclusion:
Here, the p-value is greater than the level of significance.
That is,
Thus, the decision is “fail to reject the null hypothesis”.
Therefore, the data do not provide sufficient evidence to conclude there is a significant relationship between winnings andTop 5.
State the test hypotheses.
Null hypothesis:
That is, there is not a significant relationship between winnings and Top 10.
Alternative hypothesis:
That is, there is a significant relationship between winnings and Top 10.
From the output it is found that the t statistic corresponding to Top 10 is 3.50 with df of 30 and the p value for t statistic corresponding to poles is 0.001.
Conclusion:
Here, the p-value is less than the level of significance.
That is,
Thus, the decision is “reject the null hypothesis”.
Therefore, the data provide sufficient evidence to conclude there is a significant relationship between winnings and Top 10.
Thus, only the Top 10 variable is significant to predict winnings.
3.
Create two independent variables, Top 2-5 and Top 6-10.
Find an estimated repression equation that can be used to predict Winnings ($) using Poles, Wins, Top 2-5 and Top 6-10.
Explain and draw conclusions.
Answer to Problem 2CP
The estimated repression equation that can be used to predict Winnings ($) using Poles, Wins, Top 2-5 and Top 6-10 is,
The Poles variable is not significant to predict winnings.
Explanation of Solution
Calculation:
The ‘Top 2-5’ variable is defined as the number of times the driver finished between second and fifth place and it can be obtained as by subtracting variable ‘win’ from ‘Top 5’.
Now,
| Wins | Top 5 | Top 2-5 |
| 5 | 9 | 4 |
| 1 | 19 | 18 |
| 4 | 9 | 5 |
| 3 | 12 | 9 |
| 3 | 10 | 7 |
| 2 | 14 | 12 |
| 0 | 4 | 4 |
| 3 | 13 | 10 |
| 1 | 5 | 4 |
| 1 | 9 | 8 |
| 2 | 8 | 6 |
| 4 | 14 | 10 |
| 1 | 4 | 3 |
| 1 | 8 | 7 |
| 0 | 1 | 1 |
| 0 | 3 | 3 |
| 1 | 4 | 3 |
| 0 | 3 | 3 |
| 1 | 5 | 4 |
| 0 | 2 | 2 |
| 0 | 2 | 2 |
| 0 | 2 | 2 |
| 1 | 4 | 3 |
| 0 | 4 | 4 |
| 0 | 3 | 3 |
| 1 | 2 | 1 |
| 0 | 2 | 2 |
| 0 | 1 | 1 |
| 0 | 1 | 1 |
| 0 | 1 | 1 |
| 0 | 0 | 0 |
| 0 | 1 | 1 |
| 0 | 0 | 0 |
| 0 | 0 | 0 |
| 0 | 0 | 0 |
The ‘Top 6-10’ variable is defined as the number of times the driver finished between sixth and tenth place and it can be obtained as by subtracting variable ‘Top 5’ from ‘Top 10’.
Now,
| Wins | Top 5 | Top 6-10 |
| 5 | 9 | 10 |
| 1 | 19 | 7 |
| 4 | 9 | 10 |
| 3 | 12 | 8 |
| 3 | 10 | 4 |
| 2 | 14 | 7 |
| 0 | 4 | 8 |
| 3 | 13 | 5 |
| 1 | 5 | 9 |
| 1 | 9 | 8 |
| 2 | 8 | 8 |
| 4 | 14 | 4 |
| 1 | 4 | 12 |
| 1 | 8 | 7 |
| 0 | 1 | 9 |
| 0 | 3 | 7 |
| 1 | 4 | 4 |
| 0 | 3 | 9 |
| 1 | 5 | 7 |
| 0 | 2 | 3 |
| 0 | 2 | 6 |
| 0 | 2 | 8 |
| 1 | 4 | 4 |
| 0 | 4 | 2 |
| 0 | 3 | 4 |
| 1 | 2 | 3 |
| 0 | 2 | 2 |
| 0 | 1 | 2 |
| 0 | 1 | 1 |
| 0 | 1 | 1 |
| 0 | 0 | 0 |
| 0 | 1 | 0 |
| 0 | 0 | 0 |
| 0 | 0 | 0 |
| 0 | 0 | 0 |
In the given problem winnings be the dependent variable (y), and Poles (
Regression:
Software procedure:
Step-by-step procedure to obtain regression equation using EXCEL software:
- Open an EXCEL sheet and enter the data of Driver, Points, Poles, Wins, Top2-5, Top6-10 and Winnings ($) corresponding to columns A, B, C, D, E, F, and G, respectively.
- Select Data > Data Analysis > Regression.
- Click OK.
- Under Input Y Range enter $G$1:$G$36.
- Under Input X Range enter $C$1:$F$36.
- Click the box of Labels.
- Under Output Range enter $I$1.
- Click OK.
The output using EXCEL software is given as,
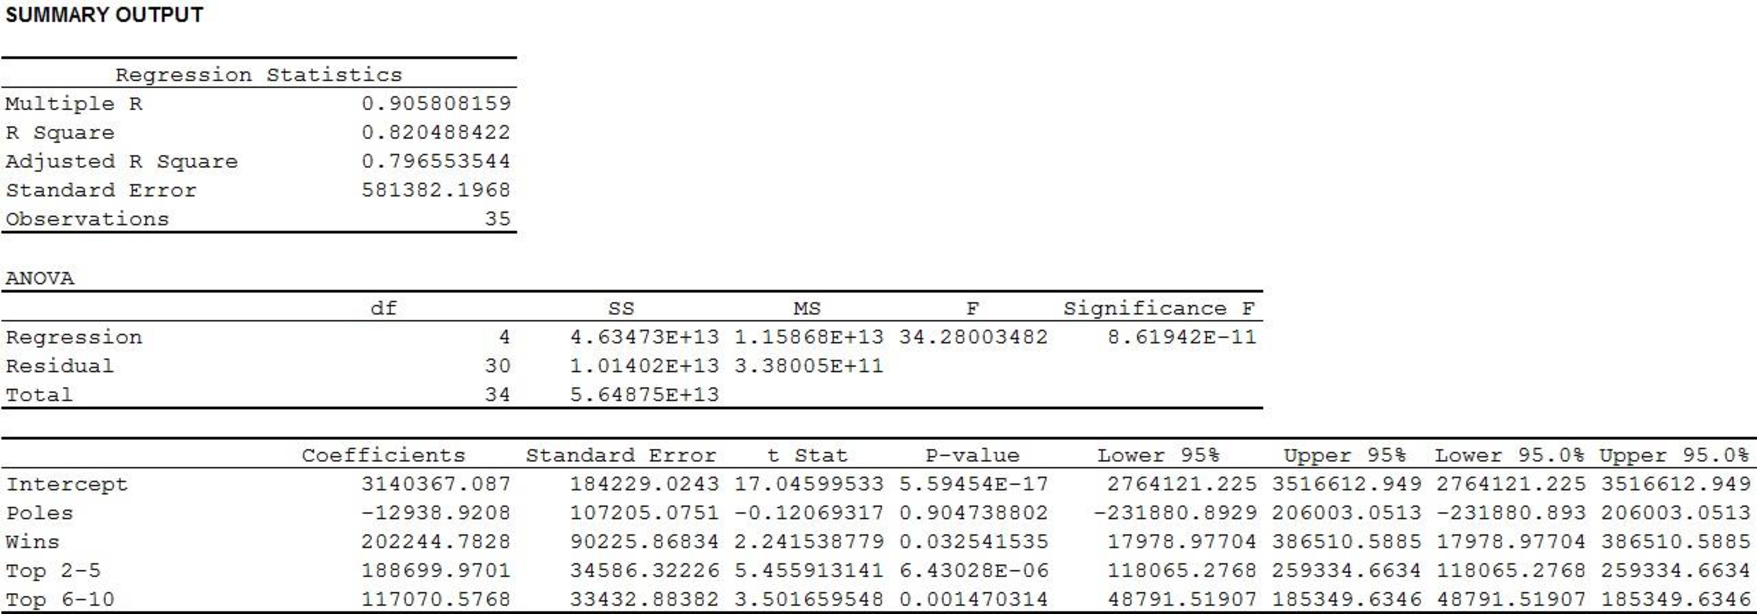
Thus, the estimated repression equation that can be used to predict Winnings ($) using Poles, Wins, Top 2-5 and Top 6-10 is approximately,
State the test hypotheses.
Null hypothesis:
That is, there is not a significant relationship between winnings and poles.
Alternative hypothesis:
That is, there is a significant relationship between winnings and poles.
From the output, it is found that the t statistic corresponding to poles is –0.12 with df of 30 and the p value for t statistic corresponding to poles is 0.905.
Conclusion:
Here, the p-value is greater than the level of significance.
That is,
Thus, the decision is “fail to reject the null hypothesis”.
Therefore, the data do not provide sufficient evidence to conclude there is a significant relationship between winnings and poles.
State the test hypotheses.
Null hypothesis:
That is, there is not a significant relationship between winnings and wins.
Alternative hypothesis:
That is, there is a significant relationship between winnings and wins.
From the output, it is found that the t statistic corresponding to wins is 2.24 with df of 30 and the p value for t statistic corresponding to poles is 0.033.
Conclusion:
Here, the p-value is less than the level of significance.
That is,
Thus, the decision is “fail to reject the null hypothesis”.
Therefore, the data provide sufficient evidence to conclude there is a significant relationship between winnings and wins.
State the test hypotheses.
Null hypothesis:
That is, there is not a significant relationship between winnings and Top 2-5.
Alternative hypothesis:
That is, there is a significant relationship between winnings and Top 2-5.
From the output, it is found that the t statistic corresponding to Top 2-5 is 5.46 with df of 30 and the p value for t statistic corresponding to poles is 0.000.
Conclusion:
Here, the p-value is less than the level of significance.
That is,
Thus, the decision is “reject the null hypothesis”.
Therefore, the data provide sufficient evidence to conclude there is a significant relationship between winnings and Top 2-5.
State the test hypotheses.
Null hypothesis:
That is, there is not a significant relationship between winnings and Top 6-10.
Alternative hypothesis:
That is, there is a significant relationship between winnings and Top 6-10.
From the output, it is found that the t statistic corresponding to Top 6-10 is 3.50 with df of 30 and the p value for t statistic corresponding to poles is 0.001.
Conclusion:
Here, the p-value is less than the level of significance.
That is,
Thus, the decision is “reject the null hypothesis”.
Therefore, the data provide sufficient evidence to conclude there is a significant relationship between winnings and Top 10.
Thus, only the Poles variable is not significant to predict winnings.
4.
Find the best estimated regression equation to predict Winnings.
Give interpretation of the estimated regression coefficients for this equation.
Answer to Problem 2CP
The best estimated regression equation to predict Winnings is,
Explanation of Solution
Calculation:
According to Part (3) it is found that only Poles variable is not significant to predict winnings. Thus, it is better to omit the variable Poles and develop he regression equation considering other variables.
In the given problem winnings be the dependent variable, and Wins, Top 2-5 and Top 6-10 are the independent variables.
Regression:
Software procedure:
Step by step procedure to obtain regression equation using EXCEL software is given as,
- Open an EXCEL sheet and enter the data of Driver, Points, Wins, Top2-5, Top6-10 and Winnings ($) corresponding to columns A, B, C, D, E, and F, respectively.
- Select Data > Data Analysis > Regression.
- Click OK.
- Under Input Y Range enter $F$1:$F$36.
- Under Input X Range enter $C$1:$E$36.
- Click the box of Labels.
- Under Output Range enter $I$1.
- Click OK.
The output using EXCEL software is given as,
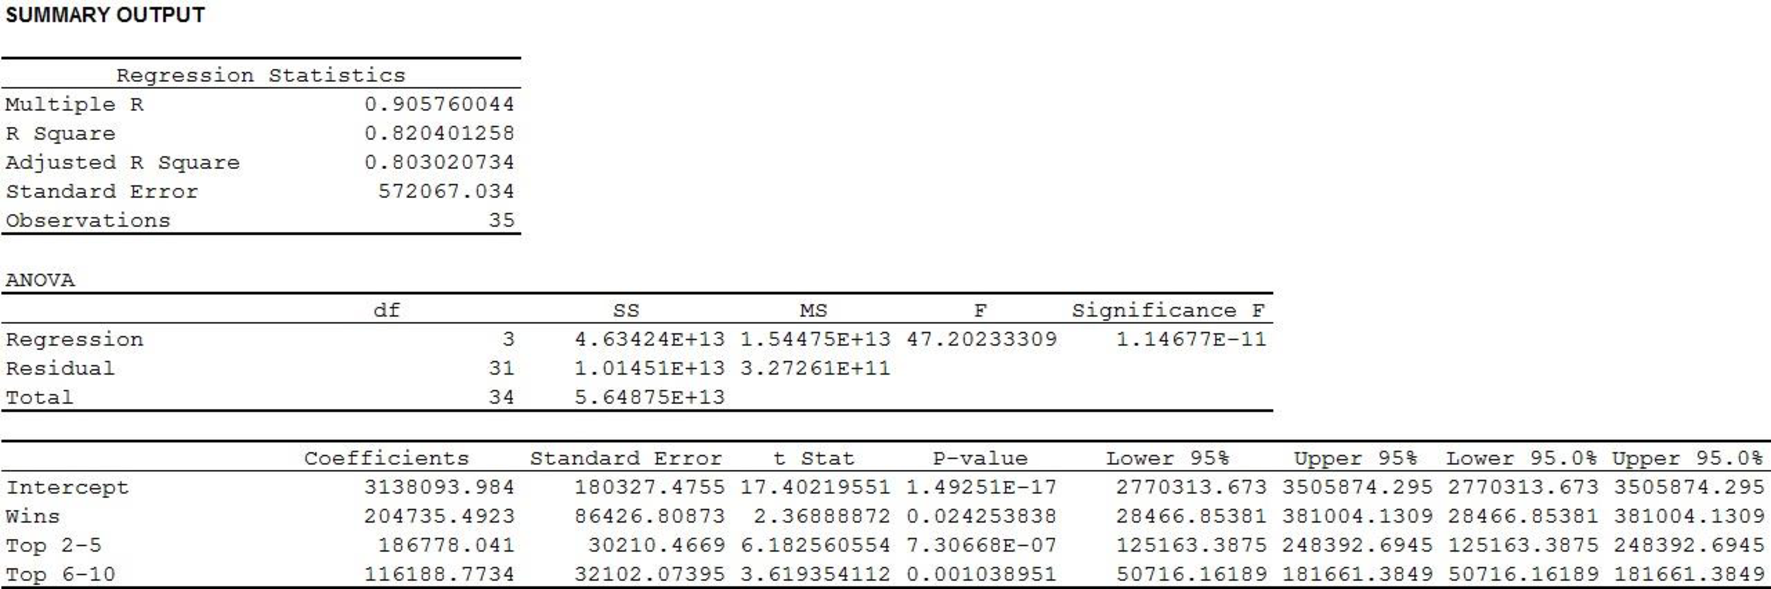
Thus, the best estimated regression equation to predict Winnings is approximately,
For Wins:
The estimated regression coefficient for Wins is 204,735.
Thus, the winnings amount will increased by $204,735 for every additional number of win holding the other variables are constant.
For Top 2-5:
The estimated regression coefficient for Top 2-5 is 186,778.
Thus, the winnings amount will increased by $186,778 for every additional number of times the driver finished between second and fifth place holding the other variables are constant.
For Top 6-10:
The estimated regression coefficient for Top 6-10 is 116,189.
Thus, the winnings amount will increased by $116,189 for every additional number of times the driver finished between sixth and tenth place holding the other variables are constant.
Want to see more full solutions like this?
Chapter 15 Solutions
Modern Business Statistics with Microsoft Office Excel (with XLSTAT Education Edition Printed Access Card) (MindTap Course List)


- Christian has been offered a new job that pays $24,000 a year plus 3% of sales. For what total sales would this new job pay more than his current job which pays $60,000?arrow_forwardTwo-fifths of the songs in Mariel’s playlist are country. If there are 16 country songs, what is the total number of songs in the playlist?arrow_forward
 Algebra: Structure And Method, Book 1AlgebraISBN:9780395977224Author:Richard G. Brown, Mary P. Dolciani, Robert H. Sorgenfrey, William L. ColePublisher:McDougal Littell
 Holt Mcdougal Larson Pre-algebra: Student Edition...AlgebraISBN:9780547587776Author:HOLT MCDOUGALPublisher:HOLT MCDOUGAL
 Elementary AlgebraAlgebraISBN:9780998625713Author:Lynn Marecek, MaryAnne Anthony-SmithPublisher:OpenStax - Rice University
 Glencoe Algebra 1, Student Edition, 9780079039897...AlgebraISBN:9780079039897Author:CarterPublisher:McGraw Hill
 Algebra for College StudentsAlgebraISBN:9781285195780Author:Jerome E. Kaufmann, Karen L. SchwittersPublisher:Cengage Learning
 Intermediate AlgebraAlgebraISBN:9781285195728Author:Jerome E. Kaufmann, Karen L. SchwittersPublisher:Cengage Learning