
Concept explainers
Use MATLAB to create a Table and plot the relationship between height of the water above ground in the water tower and water pressure in pipeline at the base of the tower and also find the height of the water tower when the pressure
Answer to Problem 2P
The height of the water tower is approximately just below
Explanation of Solution
Given info:
The relationship between the pressure and height is given by,
Here,
Calculation:
The steps to create the table and plot which shows the relationship between height and pressure in MATLAB are as follows,
- Generate a range of values for the height by an increment of
- Use the values of density and acceleration gravity in equation (1) to find the value of pressure.
- To find the value of pressure in
- To print the value of pressure at the 2 decimal digit use “format bank” command.
- Print the value of pressure for the range of height from
In the MATLAB script editor type the code as follows and save with a name of “unitconversion” as .m file, then execute the code to create the table and plot between height and pressure,
h=0:5:200;
P=(1.94)*(32.2)*(1/144)*h;
format bank
fprintf('\n-------------------------------------')
fprintf('\n\t\th(ft)\t\t\tP(lb/in^2)')
fprintf('\n--------------------------------------\n')
disp([h', P'])
fprintf('----------------------------------------')
plot(h,p)
xlabel('Height (m) ')
ylabel('Pressure (lb/in^2) ')
In the MATLAB command window the result will be displayed as follows,
-------------------------------------
h(ft)P(lb/in^2)
--------------------------------------
0 0
5.00 2.17
10.00 4.34
15.00 6.51
20.00 8.68
25.00 10.85
30.00 13.01
35.00 15.18
40.00 17.35
45.00 19.52
50.00 21.69
55.00 23.86
60.00 26.03
65.00 28.20
70.00 30.37
75.00 32.54
80.00 34.70
85.00 36.87
90.00 39.04
95.00 41.21
100.00 43.38
105.00 45.55
110.00 47.72
115.00 49.89
120.00 52.06
125.00 54.23
130.00 56.39
135.00 58.56
140.00 60.73
145.00 62.90
150.00 65.07
155.00 67.24
160.00 69.41
165.00 71.58
170.00 73.75
175.00 75.92
180.00 78.08
185.00 80.25
190.00 82.42
195.00 84.59
200.00 86.76
----------------------------------------
And the plot will displays as shown in below Figure 1,
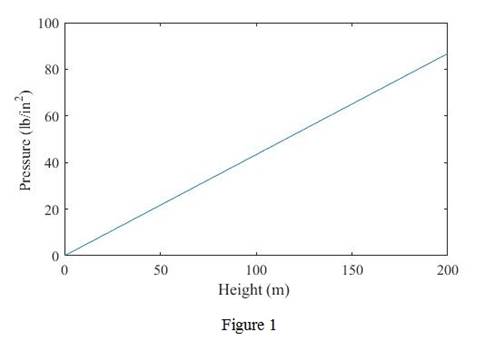
From the output of the MATLAB, the height of the water tower is approximately just below
Conclusion:
Thus, the relationship between height of the water above ground in the water tower and water pressure in pipeline at the base of the tower is shown by creating a Table in MATLAB and the height of the water tower is approximately just below
Want to see more full solutions like this?
Chapter 15 Solutions
Engineering Fundamentals: An Introduction to Engineering (MindTap Course List)


- In a laboratory experiment, a two‐fluid differential manometer is used to measure the pressure drop for a flowing process fluid, a silicone oil that is immiscible with water, as shown in Figure 2. Determine the pressure drop between Points A and B if h1 = 500 mm, h2 = 190 mm, and h3 = 275 mm. The densities of the process fluid and water are 1060 kg/m3 and 1000 kg/m3 respectively.arrow_forwardThe cantilevered beam shown in the accompanying figure is used to support a load acting on a balcony. The deflection of the centerline of the beam is given by the following equation: y = deflection at a given x location (m)w = distributed load (N/m)E = modulus of elasticity (N⁄m2 )I = second moment of area (m4 )x = distance from the support as shown ( x )L = length of the beam (m) Using Excel, plot the deflection of a beam whose length is 5 m with themodulus of elasticity of E = 200 GPa and I = 99.1×106 mm4 . The beam is designed to carry a load of 10,000 N/m. What is the maximum deflection of the beam?arrow_forwardShow the complete solution and the necessary graphs/diagrams. Use 2 decimal places in the final answer. A particle moves that is defined by the parametric equations given below (where x and y are in meters, and t is in seconds). Compute the radial component of the acceleration (m/s^2) at t = 2 seconds.arrow_forward
- The container shown in the figure holds water and air as shown. What are the pressures at A, B, C, and D?arrow_forwardSolve and show solutions. Figure 01 below. (Subject: Fluid Mechanics)arrow_forwardConsider the following body subjected to a system of forces that lie on x-y plane. If the body is in equilibrium, how many equilibrium equations can you write?arrow_forward
- 6.) The figure shows a metal hanging by a thin wire from a floating wood block. The wood block has a specific gravity Sb =0.25, a square base of 80 mm x 80 mm and height of 15 mm. The metal has a volume of 8000 mm^3. Using a unit weight of water 9800 kN/m^3 and g=9.80 m/s^2, find the tension in the thin wire in Newton. Write your answer in three decimal places. fluid mechanicsarrow_forwardShow the complete solution and the necessary graphs/diagrams. Use 2 decimal places in the final answer. A particle moves that is defined by the parametric equations given below (where x and y are in meters, and t is in seconds). Compute the transverse component of the acceleration (m/s^2) at t = 2 seconds.arrow_forward
 Engineering Fundamentals: An Introduction to Engi...Civil EngineeringISBN:9781305084766Author:Saeed MoaveniPublisher:Cengage Learning