
Videos
Parents are frequently concerned when their child seems slow to begin walking (although when the child finally walks, the resulting havoc sometimes has the parents wishing they could turn back the clock!). The article “Walking in the Newborn” (Science, 176 [1972]: 314–315) reported on an experiment in which the effects of several different treatments on the age at which a child first walks were compared.
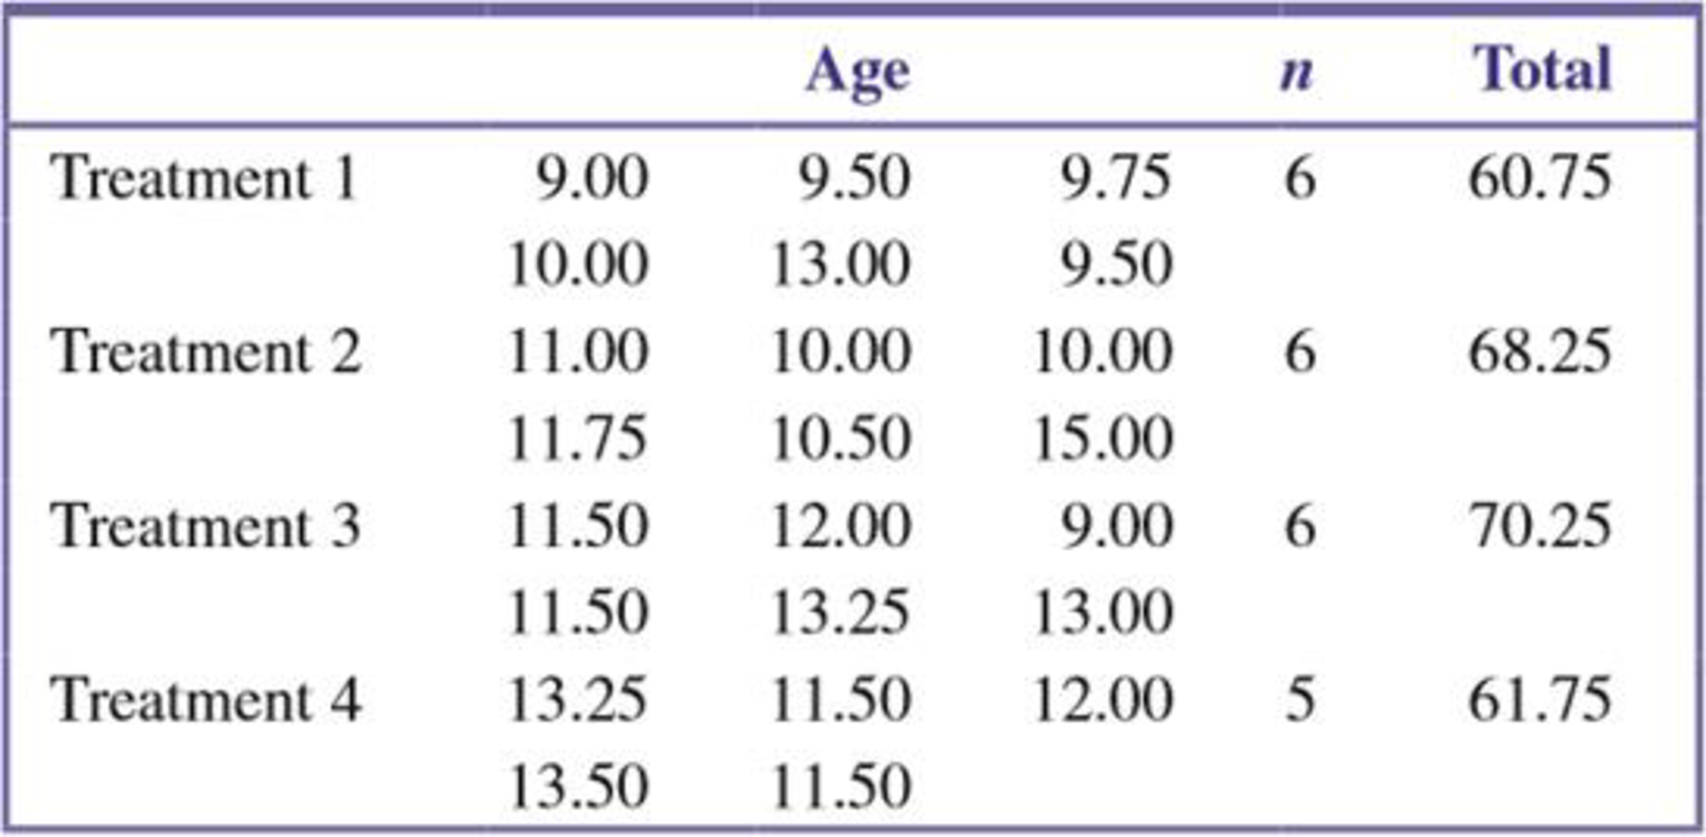
Children in the first group were given special walking exercises for 12 minutes per day beginning at age 1 week and lasting 7 weeks. The second group of children received daily exercises but not the walking exercises administered to the first group. The third and fourth groups were control groups: They received no special treatment and differed only in that the third group’s progress was checked weekly, whereas the fourth group’s progress was checked just once at the end of the study.
Observations on age (in months) when the children first walked are shown in the accompanying table. Also given is the ANOVA table, obtained from the SPSS statistical software package.
Analysis of Variance
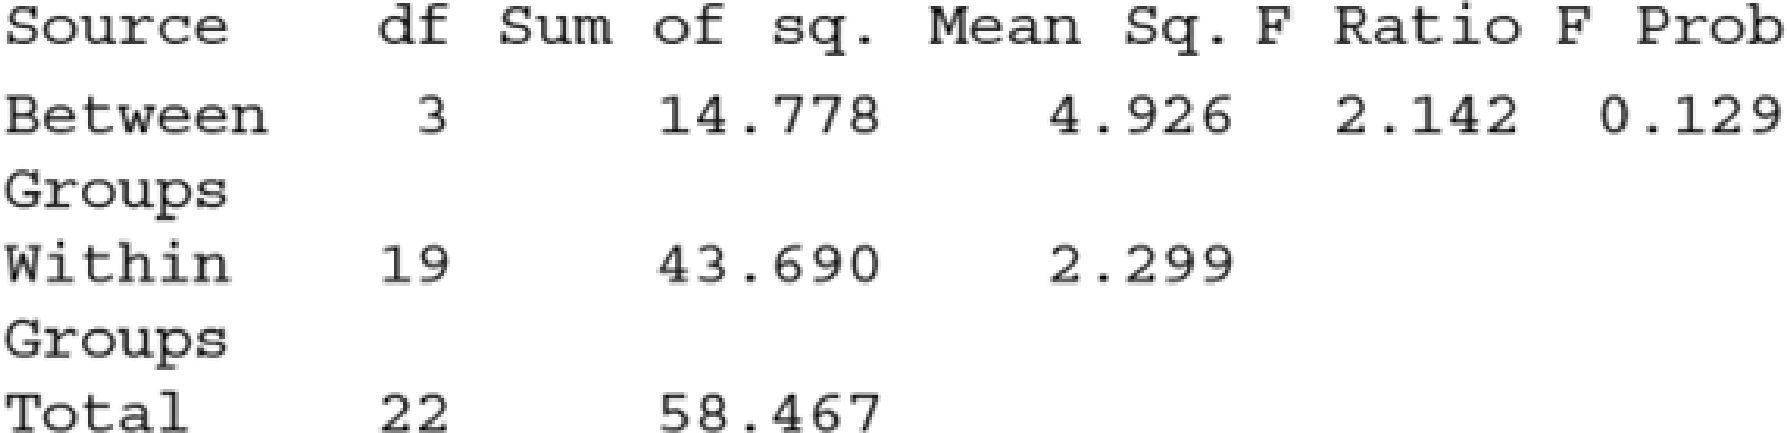
- a. Verify the entries in the ANOVA table.
- b. State and test the relevant hypotheses using a significance level of 0.05.

Trending nowThis is a popular solution!

Chapter 15 Solutions
Introduction To Statistics And Data Analysis


- 1. In the book Design and Analysis of Experiments, 8th edition (2012, John Wiley & Sons), the results of an experiment involving a storage battery used in the launching mechanism of a shoulder-fired ground-to-air missile were presented. Three material types can be used to make the battery plates. The objective is to design a battery that is relatively unaffected by the ambient temperature. The output response from the battery is effective life in hours. Three temperature levels are selected, and a factorial experiment with four replicates is run. The data are as follows: Table 11.(a) Test the appropriate hypotheses and draw conclusions using the analysis ether either firing temperature or furnace position affects the baked density of a carbon anode. The data are as follows: Table 12.(a) State the hypotheses of interest. (b) Test the hypotheses in part (a) using the analysis of variance with a = 0.05. What are your conclusions? (c) Analyze the residuals from this experiment. (d)…arrow_forwardA sample of men and women who had passed their driver's test either the first time or the second time were surveyed, with the following results: Results of the driving testGender First time Second timeMen 126 211Women 135 178a) Do these data suggest that there is a relationship between gender and the passing of their driver’s test from which the present sample was drawn? Let alpha=.05arrow_forwardIn this study, ten combat veterans undergoing treatment for PTSD were randomly sampled from a local VA hospital in a study designed to test the efficacy of an anti-anxiety medication in reducing the symptoms of PTSD. Based on clinical animal trials, the researchers predict that the drug should reduce symptoms. t= 1.63, df=9, p=0.064, d= 0.529. Before: M= 48.100, SD=1.370, SE=0.433 After: M= 47.000, SD= 1.491, SE= 0.471 My hypotheses are; H0: μbefore ≤ μafter. H1: μbefore > μafter A. State your findings in APA format: B. How would you explain these findings to someone who has never taken a statistics class? In other words, use clear direct, non-jargon language to explain the results:arrow_forward
- An experiment to determine if a migraine medication decreases a person's average number of monthly migraines is performed on 400 people who report they have several migraines a month. Researchers randomly assigned 200 people to the treatment group and 200 people to the control group. After the study, the researchers determined that 48 of the subjects in the treatment group and 28 of the subjects in the control group average fewer migraines per month. The data from the two groups are resampled 150 times, and the table shows the distribution of the differences of the proportions for the reconfigured treatment and control groups.arrow_forwardSuppose a researcher is interested inthe effectiveness in a new childhood exercise program implemented in a SRS of schools across a particular county. In order to test the hypothesis that the new program decreases BMI (Kg/m2), the researcher takes a SRS of children from schools where the program is employed and a SRS from schools that do not employ the program and compares the results. Assume the following table represents the SRSs of students and their BMIs. Student intervention group BMI (kg/m2) Student control group BMI (kg/m2) A 18.6 A 21.6 B 18.2 B 18.9 C 19.5 C 19.4 D 18.9 D 22.6 E 24.1 F 23.6 A) Assuming that all the necessary conditions are met (normality, independence, etc.) carry out the appropriate statistical test to determine if the new exercise program is effective. Use an alpha level of 0.05. Do not assume equal variances.B) Construct a 95% confidence interval about your estimate for the average difference in BMI between the groups.arrow_forwardThe authors of the article "Adjuvant Radiotherapy and Chemotherapy in Node-Positive Premenopausal Women with Breast Cancer"† reported on the results of an experiment designed to compare treating cancer patients with chemotherapy only to treatment with a combination of chemotherapy and radiation. Of the 154 individuals who received the chemotherapy-only treatment, 76 survived at least 15 years, whereas 98 of the 164 patients who received the hybrid treatment survived at least that long. With p1 denoting the proportion of all such women who, when treated with just chemotherapy, survive at least 15 years and p2 denoting the analogous proportion for the hybrid treatment, p̂1 = (rounded to three decimal places) and p̂2 = (rounded to three decimal places). A confidence interval for the difference between proportions based on the traditional formula with a confidence level of approximately 99% is 0.494 − 0.598 ± (2.58) (0.494)(0.506) 154 + (0.598)(0.402) 164…arrow_forward
- In a study of a group of women science majors who remained in their profession and a group who left their profession within a few months of graduation, the researchers collected the data shown here on a self-esteem questionnaire. Leavers Stayers 1 = 3.09 2 = 2.92 σ1 = 0.78 σ2 = 0.78 n1 = 107 n2 = 222 At α = 0.01, can it be concluded that there is a difference in the self-esteem scores of the two groups? Use the P-value method.arrow_forwardIn a Japanese study, “researchers looked at 35 peoplewith lower back pain who were enrolled in an aquatic exercise program, which included swimming and walk-ing in a pool. Almost all of the patients showed improve-ments after six months, but the researchers found that those who participated at least twice weekly showedmore significant improvement that those who wentonly once per week.”Which of the following statements is true?a) This experiment proves that swimming causes areduction in lower back pain.b) This study is a poorly designed experiment sincethere is no control group and no randomization.c) Conclusions based on this observational study aresuspect since participation in the aquatic programmay be confounded with other lifestyle behaviors thatmay cause the improvement in lower back health.d) Conclusions based on this observational study aresuspect since a sample size of 35 is too small.e) This study is not an observational study since theaquatic program is a treatment.arrow_forwardA paper investigated the driving behavior of teenagers by observing their vehicles as they left a high school parking lot and then again at a site approximately 1 2 mile from the school. Assume that it is reasonable to regard the teen drivers in this study as representative of the population of teen drivers. MaleDriver FemaleDriver 1.3 -0.3 1.3 0.6 0.9 1.1 2.1 0.7 0.7 1.1 1.3 1.2 3 0.1 1.3 0.9 0.6 0.5 2.1 0.5 (a) Use a .01 level of significance for any hypothesis tests. Data consistent with summary quantities appearing in the paper are given in the table. The measurements represent the difference between the observed vehicle speed and the posted speed limit (in miles per hour) for a sample of male teenage drivers and a sample of female teenage drivers. (Use ?males − ?females. Round your test statistic to two decimal places. Round your degrees of freedom down to the nearest whole number. Round your p-value to three decimal places.) t = df =…arrow_forward
- A paper investigated the driving behavior of teenagers by observing their vehicles as they left a high school parking lot and then again at a site approximately 1 2 mile from the school. Assume that it is reasonable to regard the teen drivers in this study as representative of the population of teen drivers. MaleDriver FemaleDriver 1.4 -0.2 1.2 0.5 0.9 1.1 2.1 0.7 0.7 1.1 1.3 1.2 3 0.1 1.3 0.9 0.6 0.5 2.1 0.5 (a) Use a .01 level of significance for any hypothesis tests. Data consistent with summary quantities appearing in the paper are given in the table. The measurements represent the difference between the observed vehicle speed and the posted speed limit (in miles per hour) for a sample of male teenage drivers and a sample of female teenage drivers. (Use ?males − ?females. Round your test statistic to two decimal places. Round your degrees of freedom down to the nearest whole number. Round your p-value to three decimal places.) t = df =…arrow_forwardA U.S. Food Survey showed that Americans routinely eat beef in their diet. Suppose that in a study of 49 consumers in Illinois and 64 consumers in Texas the following results were obtained from two samples regarding average yearly beef consumption: Illinois Texas = 49 = 64 = 54.1lb = 60.4lb S1 = 7.0 S2 = 8.0 Formulate a hypothesis so that, if the null hypothesis is rejected, we can conclude that the average amount of beef eaten annually by consumers in Illinois is significantly less than that eaten by consumers in Texas.arrow_forwardMarine biologists have noticed that the color of the outermost growth band on a clam tends to be related to the time of year in which the clam dies. A biologist conducted a small investigation of whether this is true for the species Protothaca staminea. She collected a sample of 55 clam shells in February and 55 clam shells in March. 14 of the shells from February had a dark color on the outermost growth band, whereas 8 of the shells from March had a dark color on the outermost growth band. Carry out a hypothesis test to see if there is a difference in the proportion of shells with a dark outermost growth band between the two months; specifically, if the population proportion in February is higher than March. Let ? = 0.1.Note: Do all calculations as February - MarchA) The point estimate for the true difference in proportion of dark growth bands between February and March is: Note: answer using 4 decimal precisionB) The test statistic, ztest, is: Note: answer using 2 decimal…arrow_forward
 Holt Mcdougal Larson Pre-algebra: Student Edition...AlgebraISBN:9780547587776Author:HOLT MCDOUGALPublisher:HOLT MCDOUGAL