Finding the Best Car Value When trying to decide what car to buy, real value is not necessarily determined by how much you spend on the initial purchase. Instead, cars that are reliable and don’t cost much to own often represent the best values. But, no matter how reliable or inexpensive a car may cost to own, it must also perform well.To measure value, Consumer Reports developed a statistic referred to as a value score. The value score is based upon five-year owner costs, overall road-test scores, and predicted reliability ratings. Five-year owner costs are based on the expenses incurred in the first five years of ownership, including depreciation, fuel, maintenance and repairs, and so on. Using a national average of 12,000 miles per year, an average cost per mile driven is used asthe measure of five-year owner costs. Road-test scores are the results of more than 50 tests and evaluations and are based upon a 100-point scale, with higher scores indicating better performance, comfort, convenience, and fuel economy. The highest road-test score obtained in the tests conducted by Consumer Reports was a 99 for a Lexus LS 460L. Predicted-reliability ratings (1 = Poor, 2 = Fair, 3= Good, 4 =Very Good, and 5=Excellent) are based on data from Consumer Reports’ Annual Auto Survey. A car with a value score of 1.0 is considered to be “average-value.” A car with a valuescore of 2.0 is considered to be twice as good a value as a car with a value score of 1.0; a car with a value score of 0.5 is considered half as good as average; and so on. The data for 20 family sedans, including the price ($) of each car tested, follow. (pfa picture 1. Use regression analysis to develop an estimated regression equation that could be used to predict the value score given the road-test score. 2. Use regression analysis to develop an estimated regression equation that could be used to predict the value score given the predicted-reliability. 3. What conclusions can you derive from your analysis?


Correlation
Correlation defines a relationship between two independent variables. It tells the degree to which variables move in relation to each other. When two sets of data are related to each other, there is a correlation between them.
Linear Correlation
A correlation is used to determine the relationships between numerical and categorical variables. In other words, it is an indicator of how things are connected to one another. The correlation analysis is the study of how variables are related.
Regression Analysis
Regression analysis is a statistical method in which it estimates the relationship between a dependent variable and one or more independent variable. In simple terms dependent variable is called as outcome variable and independent variable is called as predictors. Regression analysis is one of the methods to find the trends in data. The independent variable used in Regression analysis is named Predictor variable. It offers data of an associated dependent variable regarding a particular outcome.
Finding the Best Car Value
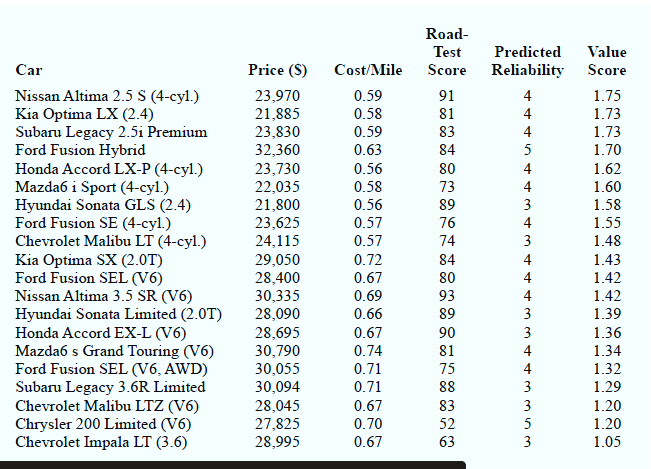
When trying to decide what car to buy, real value is not necessarily determined by how much you spend on the initial purchase. Instead, cars that are reliable and don’t cost much to own often represent the best values. But, no matter how reliable or inexpensive a car may cost to own, it must also perform well.To measure value, Consumer Reports developed a statistic referred to as a value score. The value score is based upon five-year owner costs, overall road-test scores, and predicted reliability ratings. Five-year owner costs are based on the expenses incurred in the first five years of ownership, including depreciation, fuel, maintenance and repairs, and so on. Using a national average of 12,000 miles per year, an average cost per mile driven is used asthe measure of five-year owner costs. Road-test scores are the results of more than 50 tests and evaluations and are based upon a 100-point scale, with higher scores indicating better performance, comfort, convenience, and fuel economy. The highest road-test score obtained in the tests conducted by Consumer Reports was a 99 for a Lexus LS 460L.
Predicted-reliability ratings (1 = Poor, 2 = Fair, 3= Good, 4 =Very Good, and 5=Excellent) are based on data from Consumer Reports’ Annual Auto Survey.
A car with a value score of 1.0 is considered to be “average-value.” A car with a valuescore of 2.0 is considered to be twice as good a value as a car with a value score of 1.0; a car with a value score of 0.5 is considered half as good as average; and so on. The data for 20 family sedans, including the price ($) of each car tested, follow. (pfa picture
1. Use
used to predict the value score given the road-test score.
2. Use regression analysis to develop an estimated regression equation that could be
used to predict the value score given the predicted-reliability.
3. What conclusions can you derive from your analysis?


Trending now
This is a popular solution!

Step by step
Solved in 3 steps with 4 images


