
Introduction To Statistics And Data Analysis
6th Edition
ISBN: 9781337793612
Author: PECK, Roxy.
Publisher: Cengage Learning,
expand_more
expand_more
format_list_bulleted
Videos
Textbook Question
Chapter 15, Problem 41CR
Consider the accompanying data on plant growth after the application of different types of growth hormone.
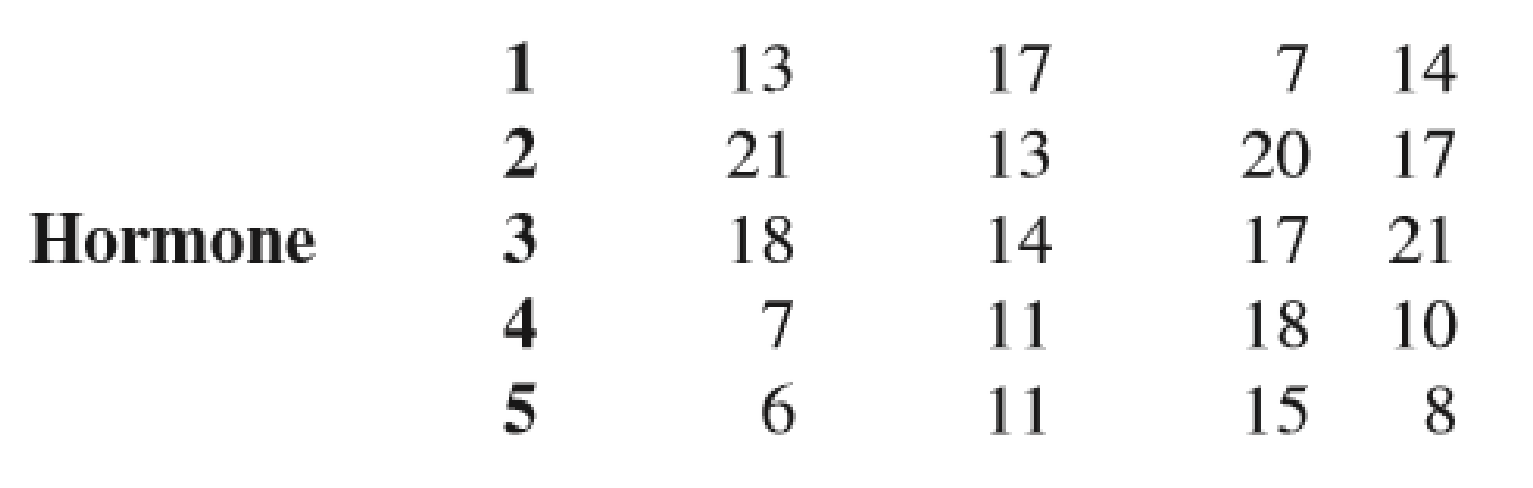
a. Carry out the F test at level α = 0.05.
b. What happens when the T-K procedure is applied? (Note: This “contradiction” can occur when H0 is “barely” rejected. It happens because the test and the multiple comparison method are based on different distributions.)
Expert Solution & Answer

Trending nowThis is a popular solution!

Students have asked these similar questions
If the test of H0: = 19 against Ha: ≠ 19 based on an SRS of 15 observations from a Normal populationproduces the statistic of t = –1.75. The P-value is
In a test of H0: µ=75 against HA: µ<75, a sample of size 450 produces Z = -1.19 for the value of the test statistic. Thus the p-value is approximately equal to:
A fisheries biologist collected a random sample of fish from a lake and conducted a chi-square goodness-of-fit test to see if the distribution of fish changed over time. The table below shows the distribution of fish that were put into the lake when it was originally stocked.
Fish Type
Trout
Bass
Perch
Sunfish
Catfish
Percent
25%
25%
20%
15%
15%
The biologist found evidence to reject the null hypothesis in favor of the alternative hypothesis. Which of the following represents the alternative hypothesis of the test?
Chapter 15 Solutions
Introduction To Statistics And Data Analysis
Ch. 15.1 - Give as much information as you can about the...Ch. 15.1 - Prob. 2ECh. 15.1 - Employees of a state university system can choose...Ch. 15.1 - The accompanying summary statistics for a measure...Ch. 15.1 - The authors of the paper Age and Violent Content...Ch. 15.1 - The paper referenced in the previous exercise also...Ch. 15.1 - Do people feel hungrier after sampling a healthy...Ch. 15.1 - Prob. 8ECh. 15.1 - The Paper Womens and Mens Eating Behavior...Ch. 15.1 - Can use of an online plagiarism-detection system...
Ch. 15.1 - Prob. 11ECh. 15.1 - In the introduction to this chapter, we considered...Ch. 15.1 - In an experiment to investigate the performance of...Ch. 15.2 - Leaf surface area is an important variable in...Ch. 15.2 - Prob. 15ECh. 15.2 - Prob. 16ECh. 15.2 - Prob. 17ECh. 15.2 - The paper referenced in Exercise 15.5 described an...Ch. 15.2 - Prob. 19ECh. 15.2 - The accompanying data resulted from a flammability...Ch. 15.2 - Do lizards play a role in spreading plant seeds?...Ch. 15.2 - Samples of six different brands of diet or...Ch. 15.3 - A particular county employs three assessors who...Ch. 15.3 - The accompanying display is a partially completed...Ch. 15.3 - With the use of biofuels increasing, investigators...Ch. 15.3 - Prob. 26ECh. 15.3 - Prob. 27ECh. 15.3 - Prob. 28ECh. 15.4 - Prob. 29ECh. 15.4 - The paper Feedback Enhances the Positive Effects...Ch. 15.4 - The following graphs appear in the paper Which...Ch. 15.4 - The behavior of undergraduate students when...Ch. 15.4 - Prob. 33ECh. 15.4 - The following partially completed ANOVA table...Ch. 15.4 - Prob. 35ECh. 15.4 - The accompanying ANOVA table is similar to one...Ch. 15.4 - Identification of sex in human skeletons is an...Ch. 15 - Suppose that a random sample or size n = 5 was...Ch. 15 - Parents are frequently concerned when their child...Ch. 15 - Prob. 40CRCh. 15 - Consider the accompanying data on plant growth...Ch. 15 - Prob. 42CRCh. 15 - Prob. 43CRCh. 15 - Prob. 44CRCh. 15 - Prob. 45CRCh. 15 - Prob. 46CRCh. 15 - Prob. 47CRCh. 15 - Prob. 48CRCh. 15 - Prob. 49CR
Knowledge Booster


Learn more about
Need a deep-dive on the concept behind this application? Look no further. Learn more about this topic, statistics and related others by exploring similar questions and additional content below.Similar questions
- The data below are from an independent-measures experiment comparing three different treatment conditions. Treatment 1 Treatment 2 Treatment 3 0 1 4 0 4 3 0 1 6 2 0 3 Find the following: F critical value:arrow_forwardThe following data are from a repeated-measures experiment comparing three different treatment conditions. Participant Treatment A Treatment B Treatment C A 0 1 2 B 2 5 5 C 1 2 6 D 5 4 9 E 2 8 8 TA= 10 TB= 20 TC= 30 G= 60 SSA= 14 SSB= 30 SSc= 30 SStotal=370 Conduct a repeated measures ANOVA with alpha =.05 to determine whether there are any difference between the means. Show work for all intermediary steps and include a source table for the ANOVA and calculate the partial η2 for the effect of treatment on scores. conduct any post hoc tests to determine mean differences (if the ANOVA is significant). Set up a dataset on SPSS with data from the last problem. Calculate the ANOVA and partial η2 and report the F statistic in APA format:arrow_forwardA dietitian wishes to see if a person’s cholesterol level will be changed if the diet is supplemented by a certain mineral. Four subjects were pre-tested, and they took the mineral supplement for a 6-week period. The results are shown in the table. Is there sufficient evidence to conclude that the population mean of cholesterol levels has been changed after six weeks at α=0.2α=0.2? Assume that the differences are from an approximately normally distributed population. Subject Cholestrol Level (mg/dl) Cholestrol Level after 6 Weeks (mg/dl) dd ¯dd¯ (d−¯d)2(d-d¯)2 1 206 217 11 2 219 184 -35 3 202 204 2 4 213 205 -8 Total -30 a) Calculate the mean, the sum of the squared deviation from the mean, and the standard deviation of differences. Do not include the unit for each answer: ¯d=d¯= (do not round) ∑(d−¯d)2=∑(d-d¯)2= (do not round) sd=sd= (rounded to one decimal place) b) Perform the hypothesis test in the following steps: Step 1.…arrow_forward
- A snack food manufacturer estimates that the variance of the number of grams of carbohydrates in servings of its tortilla chips is 1.34. A dietician is asked to test this claim and finds that a random sample of 16 servings has a variance of 1.22. At α=0.05, is there enough evidence to reject the manufacturer's claim? Assume the population is normally distributed. Complete parts (a) through (e) below.arrow_forwardA snack food manufacturer estimates that the variance of the number of grams of carbohydrates in servings of its tortilla chips is 1.33. A dietician is asked to test this claim and finds that a random sample of 24 servings has a variance of 1.37. At α=0.01, is there enough evidence to reject the manufacturer's claim? Assume the population is normally distributed. Complete parts (a) through (e) below. (a) Write the claim mathematically and identify H0 and Ha. A. H0: σ2≤1.33 (Claim) Ha: σ2>1.33 B. H0: σ2≠1.33 Ha: σ2=1.33 (Claim) C. H0: σ2≥1.33 Ha: σ2<1.33 (Claim) D. H0: σ2=1.33 (Claim) Ha: σ2≠1.33 (b) Find the critical value(s) and identify the rejection region(s). The critical value(s) is(are) enter your response here. (Round to two decimal places as needed. Use a comma to separate answers as needed.) Choose the correct statement below and fill in the corresponding answer boxes. A. The…arrow_forwardAs we have noted in previous chapters, even a very small effect can be significant if the sample is large enough. Suppose, for example, that a researcher obtains a correlation (computed from the raw data) of r = 0.60 for a sample of n = 10 participants. (4 pts. total) Is this sample sufficient to conclude that a significant correlation exists in the population? Use a two-tailed test with α = .05. In your response, be sure to specify the critical value for r.arrow_forward
- Are seatbelts effective at saving lives? We wish to examine whether or not the use of seatbelts reduces fatalities at the alpha = 0.05 level of significance. Let p N represent the proportion of non-seatbelt wearing passengers who were involved in a crash and died and represent the proportion of seatbelt wearing passengers who were involved in a crash and died. 1. Which would be correct hypotheses for this test? H 0 :p N =p Y ,H 1 :p N <p Y O H 0 :p N =p Y ,H 1 :p N ne p Y H 0 :p N =p Y ,H 1 :p N > mathfrak P Y O H 0 :p N ne p Y , H 1 :p N >p Y In a random sample of 335 non-seatbelt wearing passengers involved in a car crash, 34 were killed. In a random sample of 398 seatbelt wearing passengers involved in a car crash , 18 were killed. 2. Find the test statistic (2 decimal places) 3. Give the P-value (4 decimal places) please only answer 2 and 3!arrow_forwardRefer to Exercise 8.S.1. Compare the before and after populations using a t test at α = 0.05. Use a nondirectional alternative.arrow_forwardSerum nitrite concentrations (in μmol/L) were compared between a group of unmedicated HIV+ subjects (n =7) and a control group (n = 10). The HIV+ distribution is strongly skewed.a) Use a Wilcoxon-Mann-Whitney U test to determine if there is convincing evidence at α = 0.05 thatserum nitrite levels differ between the two populations. b) What would have been the U test p-value if researchers had instead hypothesized that serum nitriteconcentrations would tend to be larger in the HIV+ population? HIV+ Control 0.266 0.167 0.269 0.201 0.299 0.205 0.335 0.232 0.503 0.234 0.846 0.260 0.946 0.268 0.288 0.301 0.305arrow_forward
- Serum nitrite concentrations (in μmol/L) were compared between a group of unmedicated HIV+ subjects (n =7) and a control group (n = 10). The HIV+ distribution is strongly skewed. a) Use a Wilcoxon-Mann-Whitney U test to determine if there is convincing evidence at α = 0.05 thatserum nitrite levels differ between the two populations. b) What would have been the U test p-value if researchers had instead hypothesized that serum nitriteconcentrations would tend to be larger in the HIV+ population?arrow_forwardThe owner of Showtime Movie Theaters, Inc., would like to predict weekly gross revenue as a function of advertising expenditures. Historical data for a sample of eight weeks follow. Weekly Gross Revenue ($1000s) Televison Advertising ($1000s) Newspaper Advertising ($1000s) 97 6 1.5 90 2 2 95 5 1.5 93 3.5 2.5 95 3 4.3 95 3.5 3.3 95 3.5 4.2 95 4 2.5 a. Use alpha= 0.01 to test the hypotheses Ho : Beta Sub1= Beta Sub2 =0 Ha : Beta Sub1 and/or Beta Sub2 is not equal to zero for the model y=Beta Sub 0+ Beta Sub1 Xsub1+Beta Sub2 Xsub2+E , where X1= television advertising ($1000s) X2+ newspaper advertising ($1000s) Compute the F test statistic (to 2 decimals). Use F table. What is the p-value? - Select your answer -less than .01between .01 and .025between .025 and .05between .05 and .10greater than .10Item 2 What is your conclusion? - Select your answer -The overall model is not significantThe overall model is significantItem 3 b. Use alpha =0.05 to…arrow_forward
arrow_back_ios
arrow_forward_ios
Recommended textbooks for you
 Glencoe Algebra 1, Student Edition, 9780079039897...AlgebraISBN:9780079039897Author:CarterPublisher:McGraw Hill
Glencoe Algebra 1, Student Edition, 9780079039897...
Algebra
ISBN:9780079039897
Author:Carter
Publisher:McGraw Hill
Hypothesis Testing using Confidence Interval Approach; Author: BUM2413 Applied Statistics UMP;https://www.youtube.com/watch?v=Hq1l3e9pLyY;License: Standard YouTube License, CC-BY
Hypothesis Testing - Difference of Two Means - Student's -Distribution & Normal Distribution; Author: The Organic Chemistry Tutor;https://www.youtube.com/watch?v=UcZwyzwWU7o;License: Standard Youtube License