
Concept explainers
Videos
Recall that in exercise 44, the admissions officer for Clearwater College developed the following estimated regression equation relating final college GPA to the student’s SAT mathematics score and high-school GPA.
where
x1 = high-school grade point average
x2 = SAT mathematics score
y = final college grade point average
A portion of the Excel Regression tool output follows.
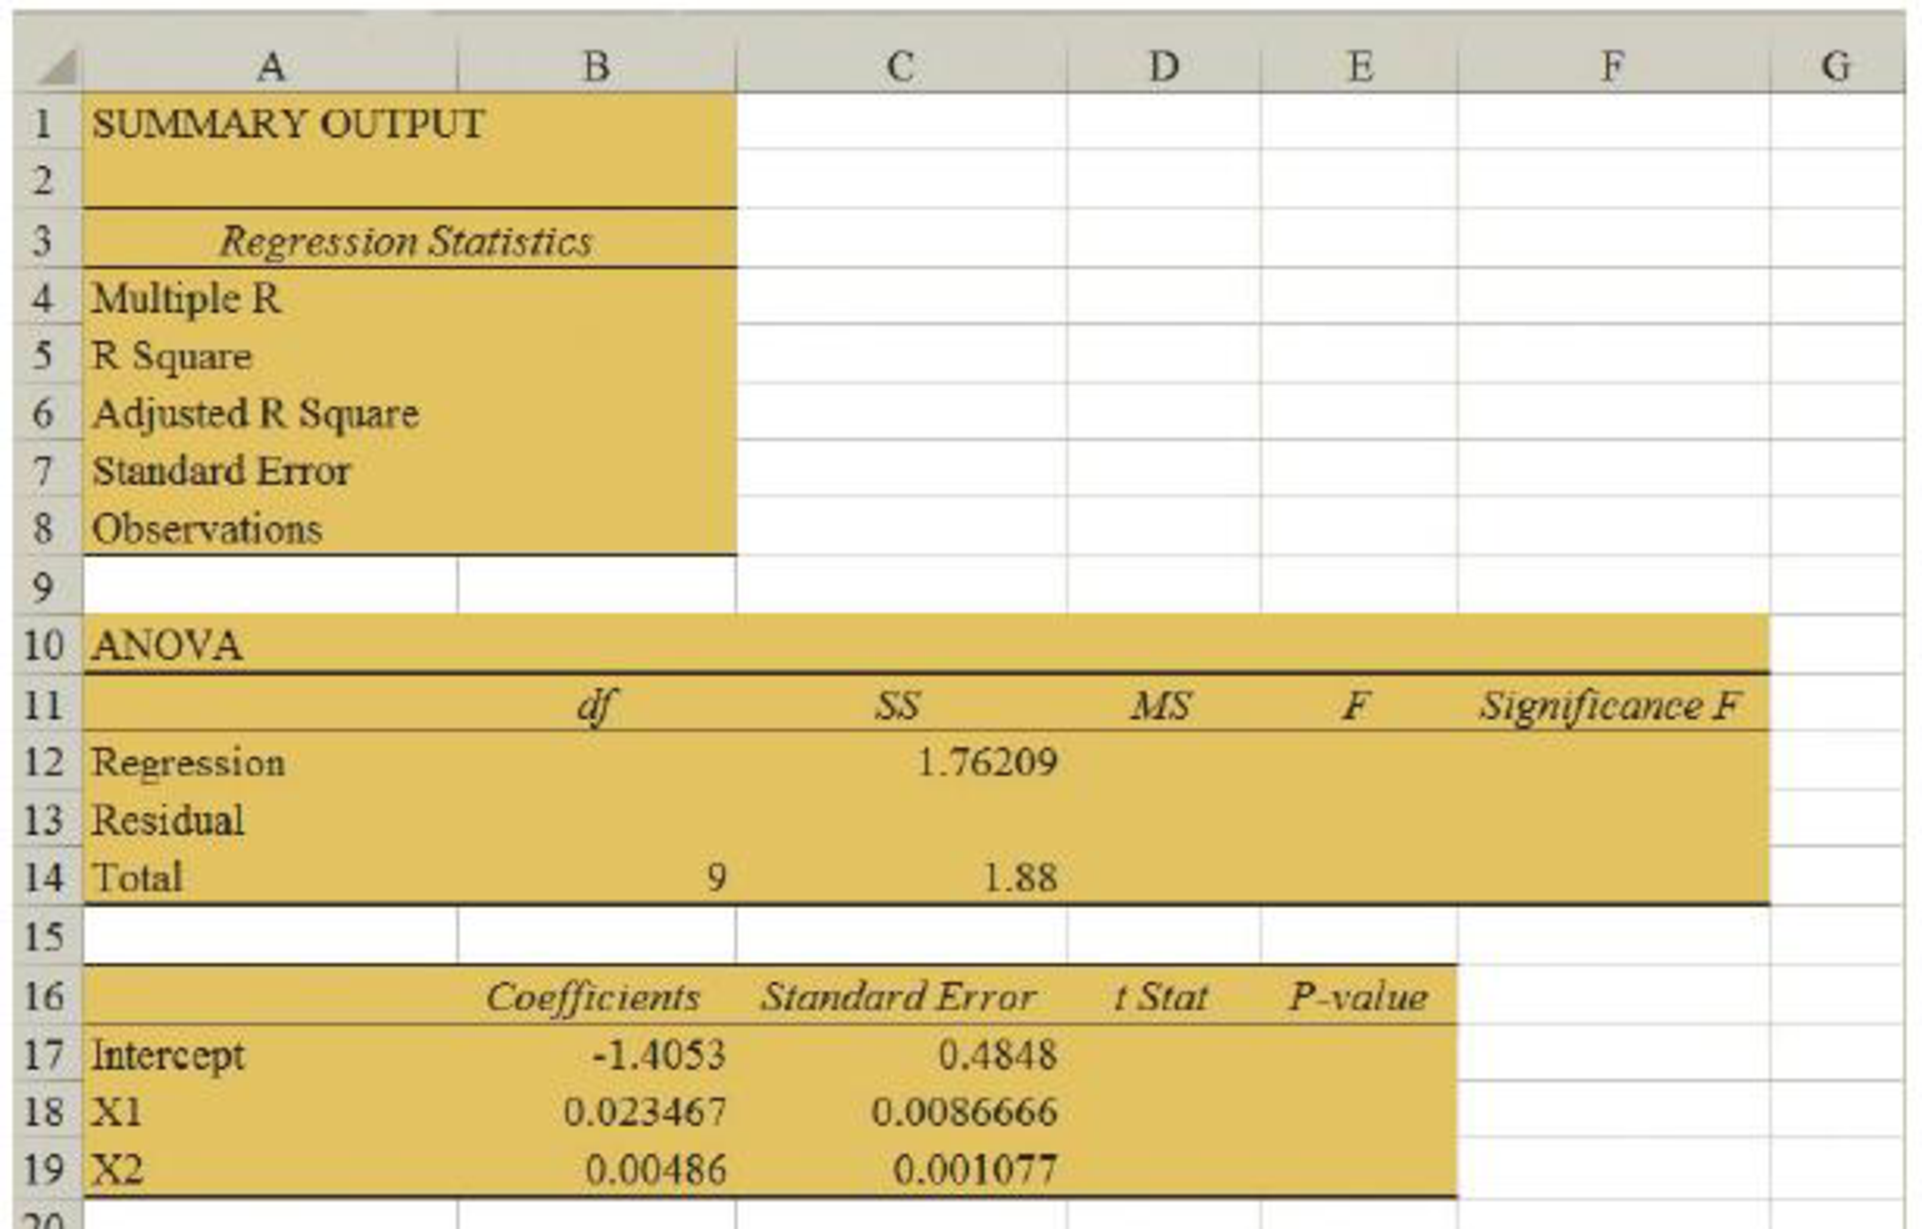
- a. Complete the missing entries in this output.
- b. Using α = .05, test for overall significance.
- c. Did the estimated regression equation provide a good fit to the data? Explain.
- d. Use the t test and α = .05 to test H0: β1 = 0 and H0: β2 = 0.
44. The admissions officer for Clearwater College developed the following estimated regression equation relating the final college GPA to the student’s SAT mathematics score and high-school GPA.
where
x1 = high-school grade point average
x2 = SAT mathematics score
y = final college grade point average
- a. Interpret the coefficients in this estimated regression equation.
- b. Predict the final college GPA for a student who has a high-school average of 84 and a score of 540 on the SAT mathematics test.

Trending nowThis is a popular solution!

Chapter 15 Solutions
Modern Business Statistics with Microsoft Office Excel (with XLSTAT Education Edition Printed Access Card) (MindTap Course List)


- Find the equation of the regression line for the following data set. x 1 2 3 y 0 3 4arrow_forwardIf your graphing calculator is capable of computing a least-squares sinusoidal regression model, use it to find a second model for the data. Graph this new equation along with your first model. How do they compare?arrow_forwardA researcher examined the relationship between the annual tax amount paid by the construction company owners and the total expense items spent for the construction with regression analysis and calculated the regression line estimation as Y=6+2X. According to this; Write the interpretations of the cutoff and regression parameters, respectively, in your OWN SENTENCES in a statistically appropriate way over the tax amount and expenses.arrow_forward
- A researcher was interested in investigating whether the parent-child interaction time (in hours) is a predictor of a child's cognitive development. A sample of 9 children shown their parent-child interaction time and cognitive tests scores as below. 1. Base on the regression equation, estimate the predicted cognitive level for a child whose parent interacts with him 6 hours per day?arrow_forwardThe owner of Original Italian Pizza restaurant chain wants to understand which variable most strongly influences the sales of his specialty deep-dish pizza. He has gathered data on the monthly sales of deep-dish pizzas at his restaurants and observations on other potentially relevant variables for each of several outlets in central Indiana. These data are provided in the file P10_04.xlsx. Estimate a simple linear regression equation between the quantity sold (Y) and each of the following candidates for the best explanatory variable: average price of deep-dish pizzas (X1), monthly advertising expenditures (X2), and disposable income per household in the areas surrounding the outlets (X3). Round your answers for intercept coefficients to the nearest whole number and slope coefficients to two decimal places, if necessary. If your answer is negative number, enter "minus" sign.arrow_forwardDevelop an estimated multiple regression equation that relates risk of a stroke to a person's age, systolic blood pressure and whether the person is a smoker. x1=persons age x2systrolic blood pressure x3=whether person is a smoker or non smokerarrow_forward
- The product manager for a brand of all-natural herbal shampoo has compiled 15 weeks of data on the weekly sales of the brand (in units), the level of media advertising (in thousands of dollars), the price (in dollars), and the use of displays (in number of stores with the brand on an end-aisle display). She then carried out a multiple regression analysis on these data in order to calculate a price elasticity. Her data and the results of the regression analysis can be seen below. Name each of the variables that were used in this multiple regression analysis. For each of these variables, indicate whether it was an independent variable or a dependent variable in this regression analysis. Use these data and the results of the regression analysis to calculate the price elasticity for this shampoo brand. Show your work. Based on the course material, describe two issues that should lead the product manager to not entirely trust the price elasticity calculated from this analysis.arrow_forwardAt a .01 level of significance is there sufficient evidence to conclude that the number of books sold is related to the number of registered students in a straight-line manner, and give the regression equation.arrow_forwardShow that the regression line that runs through the standardized data values has the formarrow_forward
- The Life Insurance Company is attempting to model the weight, Y (in pounds), of a random sample of n=92 randomly selected adults using height, X1 (in inches), and gender, I2 (0 = Male 1=Female). In addition, as part of the research objective, we also wish to determine if the influence of height (X1) on weight (Y) depends on gender (I2) and vice versa. Write out the general regression equation for this model, based on the research objectives and information provided. Using the general equation from part A, write out the specific regression equation for a female. Using the general equation from part A, write out the specific regression equation for a male. If it was found that the influence of height on weight did NOT depend on gender, how would this change the equation given in part A of this problem? Rewrite the general equation from part A here.arrow_forwardcreate graph of the two-variable data with a regression line, r, r2, and separate residual plotarrow_forwardA social scientist collects information about counties in California and finds that the correlation between average income of the county and a rating of healthcare quality in the county is 0.78. A scatterplot of the two variables is football shaped. A particular county has an average income that is 0.4 SDs above the average of all counties. Using regression, we would predict that its healthcare quality is _________ SDs above the average healthcare quality for all counties, and that it is therefore at the _________ percentile of healthcare quality among all counties. Choose the answer below to fill in the two blanks. Group of answer choices 0.31; 24th 0.78; 58th 0.78; 79th 0.31; 62nd PreviousNextarrow_forward
 Algebra and Trigonometry (MindTap Course List)AlgebraISBN:9781305071742Author:James Stewart, Lothar Redlin, Saleem WatsonPublisher:Cengage Learning
 Trigonometry (MindTap Course List)TrigonometryISBN:9781305652224Author:Charles P. McKeague, Mark D. TurnerPublisher:Cengage Learning
 Functions and Change: A Modeling Approach to Coll...AlgebraISBN:9781337111348Author:Bruce Crauder, Benny Evans, Alan NoellPublisher:Cengage Learning