
Statistics for Business & Economics, Revised (MindTap Course List)
12th Edition
ISBN: 9781285846323
Author: David R. Anderson, Dennis J. Sweeney, Thomas A. Williams, Jeffrey D. Camm, James J. Cochran
Publisher: South-Western College Pub
expand_more
expand_more
format_list_bulleted
Concept explainers
Videos
Textbook Question
Chapter 15, Problem 51SE
A partial computer output from a
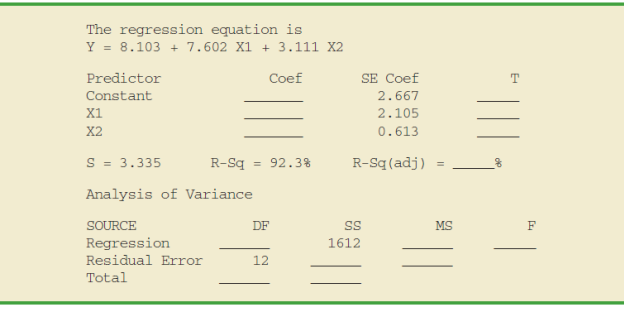
- a. Compute the missing entries in this output.
- b. Use the F test and α = .05 to see whether a significant relationship is present.
- c. Use the t test and α = .05 to test H0: β1 = 0 and H0: β2 = 0.
- d. Compute
Expert Solution & Answer

Trending nowThis is a popular solution!

Students have asked these similar questions
Consider the following correlations -0.9 , -0.5 , -0.2 , 0 , 0.2 , 0.5 and 0.9. For each give the fraction of the variation in y that is explained by the least-squares regression of y on x.
Consider the following data for a dependent variable y and two independent variables,
x1
and
x2.
x1
x2
y
30
12
94
47
10
108
25
17
112
51
16
178
40
5
94
51
19
175
74
7
170
36
12
117
59
13
142
76
16
211
(a)
Develop an estimated regression equation relating y to
x1.
(Round your numerical values to one decimal place.)
ŷ =
−18.4+2+4.74x2
Predict y if
x1 = 76.
(Round your answer to one decimal place.)
(b)
Develop an estimated regression equation relating y to
x2.
(Round your numerical values to one decimal place.)
ŷ =
Predict y if
x2 = 16.
(Round your answer to one decimal place.)
(c)
Develop an estimated regression equation relating y to
x1 and x2.
(Round your numerical values to one decimal place.)
ŷ =
Predict y if
x1 = 76
and
x2 = 16.
(Round your answer to one decimal place.)
Consider the following sample regressions for the linear and quadratic models along with their respective R2 and adjusted R2.
Linear
Quadratic
Intercept
13.3087
1.7656
x
0.3392
4.0966
x2
NA
-0.2528
R2
0.1317
0.5844
Adjusted R2
0.0232
0.4657
Choose the model with the best fit, and then predict y for x = 4, 8, and 12. ROUND TO TWO DECIMAL PLACES.
x
Predicted y
4
8
12
Chapter 15 Solutions
Statistics for Business & Economics, Revised (MindTap Course List)
Ch. 15.2 - The estimated regression equation for a model...Ch. 15.2 - Consider the following data for a dependent...Ch. 15.2 - In a regression analysis involving 30...Ch. 15.2 - A shoe store developed the following estimated...Ch. 15.2 - The owner of Showtime Movie Theaters, Inc., would...Ch. 15.2 - The National Football League (NFL) records a...Ch. 15.2 - PC World rated four component characteristics for...Ch. 15.2 - The Cond Nast Traveler Gold List provides ratings...Ch. 15.2 - Waterskiing and wakeboarding are two popular...Ch. 15.2 - Prob. 10E
Ch. 15.3 - In exercise 1, the following estimated regression...Ch. 15.3 - Prob. 12ECh. 15.3 - In exercise 3, the following estimated regression...Ch. 15.3 - In exercise 4, the following estimated regression...Ch. 15.3 - In exercise 5, the owner of Showtime Movie...Ch. 15.3 - In exercise 6, data were given on the average...Ch. 15.3 - Prob. 17ECh. 15.3 - Prob. 18ECh. 15.5 - In exercise 1, the following estimated regression...Ch. 15.5 - Refer to the data presented in exercise 2. The...Ch. 15.5 - The following estimated regression equation was...Ch. 15.5 - In exercise 4, the following estimated regression...Ch. 15.5 - Prob. 23ECh. 15.5 - The Wall Street Journal conducted a study of...Ch. 15.5 - The Cond Nast Traveler Gold List for 2012 provided...Ch. 15.5 - In exercise 10, data showing the values of several...Ch. 15.6 - In exercise 1, the following estimated regression...Ch. 15.6 - Refer to the data in exercise 2. The estimated...Ch. 15.6 - In exercise 5, the owner of Showtime Movie...Ch. 15.6 - Prob. 30ECh. 15.6 - The American Association of Individual Investors...Ch. 15.7 - Consider a regression study involving a dependent...Ch. 15.7 - Consider a regression study involving a dependent...Ch. 15.7 - Management proposed the following regression model...Ch. 15.7 - Refer to the Johnson Filtration problem introduced...Ch. 15.7 - This problem is an extension of the situation...Ch. 15.7 - The Consumer Reports Restaurant Customer...Ch. 15.7 - A 10-year study conducted by the American Heart...Ch. 15.8 - Data for two variables, x and y, follow. xi 1 2 3...Ch. 15.8 - Data for two variables, x and y, follow. xi 22 24...Ch. 15.8 - Exercise 5 gave the following data on weekly gross...Ch. 15.8 - The following data show the curb weight,...Ch. 15.8 - Prob. 43ECh. 15.9 - Refer to the Simmons Stores example introduced in...Ch. 15.9 - In Table 15.12 we provided estimates of the...Ch. 15.9 - Community Bank would like to increase the number...Ch. 15.9 - Over the past few years the percentage of students...Ch. 15.9 - The Tire Rack maintains an independent consumer...Ch. 15 - The admissions officer for Clearwater College...Ch. 15 - The personnel director for Electronics Associates...Ch. 15 - A partial computer output from a regression...Ch. 15 - Recall that in exercise 49, the admissions officer...Ch. 15 - Recall that in exercise 50 the personnel director...Ch. 15 - The Tire Rack, Americas leading online distributor...Ch. 15 - The Department of Energy and the U.S....Ch. 15 - A portion of a data set containing information for...Ch. 15 - Fortune magazine publishes an annual list of the...Ch. 15 - Consumer Research, Inc., is an independent agency...Ch. 15 - Matt Kenseth won the 2012 Daytona 500, the most...Ch. 15 - Finding the Best Car Value When trying to decide...
Knowledge Booster


Learn more about
Need a deep-dive on the concept behind this application? Look no further. Learn more about this topic, statistics and related others by exploring similar questions and additional content below.Similar questions
- The following fictitious table shows kryptonite price, in dollar per gram, t years after 2006. t= Years since 2006 0 1 2 3 4 5 6 7 8 9 10 K= Price 56 51 50 55 58 52 45 43 44 48 51 Make a quartic model of these data. Round the regression parameters to two decimal places.arrow_forwardOlympic Pole Vault The graph in Figure 7 indicates that in recent years the winning Olympic men’s pole vault height has fallen below the value predicted by the regression line in Example 2. This might have occurred because when the pole vault was a new event there was much room for improvement in vaulters’ performances, whereas now even the best training can produce only incremental advances. Let’s see whether concentrating on more recent results gives a better predictor of future records. (a) Use the data in Table 2 (page 176) to complete the table of winning pole vault heights shown in the margin. (Note that we are using x=0 to correspond to the year 1972, where this restricted data set begins.) (b) Find the regression line for the data in part ‚(a). (c) Plot the data and the regression line on the same axes. Does the regression line seem to provide a good model for the data? (d) What does the regression line predict as the winning pole vault height for the 2012 Olympics? Compare this predicted value to the actual 2012 winning height of 5.97 m, as described on page 177. Has this new regression line provided a better prediction than the line in Example 2?arrow_forwardThe following table shows the annual number of PhD graduates in a country in various fields. NaturalSciences Engineering SocialSciences Education 1990 70 10 60 30 1995 130 40 100 50 2000 330 130 280 140 2005 490 370 460 210 2010 590 550 830 520 2012 690 590 1,000 900 (a) With x = the number of social science doctorates and y = the number of education doctorates, use technology to obtain the regression equation. (Round coefficients to three significant digits.) y(x) =arrow_forward
- A sixth-grade teacher believes that there is a relationship between his students’ IQscores (y) and the numbers of hours (x) they spend watching television each week. Thefollowing table shows a random sample of 7 sixth-grade students.y 125 116 97 114 85 107 105x 5 10 30 16 41 28 21 Does the data provide sufficient evidence to indicate that the simple linear regressionmodel is appropriate to describe the relationship between x and y? Perform a model utilitytest at α = 0.05. (Give H0, Ha, rejection region, observed test statistic, P-value, decisionand conclusion.)Find the Pearson sample correlation coefficient between x and y. Then interpretthe result.arrow_forwardThe following table shows the annual number of PhD graduates in a country in various fields. NaturalSciences Engineering SocialSciences Education 1990 70 10 60 30 1995 130 40 120 40 2000 330 130 280 120 2005 490 370 460 210 2010 590 550 830 520 2012 690 590 1,000 900 (a)With x = the number of social science doctorates and y = the number of education doctorates, use technology to obtain the regression equation. (Round coefficients to three significant digits.) y(x) =arrow_forwardConsider the following population linear regression model of individual food expenditure: Y = 50 + 0.5X + u, where Y is weekly food expenditure in dollars, X is the individual’s age, and 50+0.5X is the population regression line. Suppose we generate artificial data for 3 individuals using this model. This artificial sample, which consists of 3 observations, is shown in the following table: Answer the following questions. Show your working. (a) What are the values of V1 and V4? (b) Suppose we know that in this artificial sample, the sample covariance between X and Y is 150, and the sample variance of X is 100. Compute the OLS regression line of the regression of Y on X. (Hint: Assume these summary statistics and the OLS regression line continue to hold in parts (c)-(e).) (c) What are the values of V5 and V7?arrow_forward
- The following table shows the annual number of PhD graduates in a country in various fields. NaturalSciences Engineering SocialSciences Education 1990 70 10 70 30 1995 130 40 110 40 2000 330 130 280 120 2005 490 370 460 210 2010 590 550 830 520 2012 690 590 1,000 900 (a) With x = the number of social science doctorates and y = the number of education doctorates, use technology to obtain the regression equation. (Round coefficients to three significant digits.) y(x) = (b) Use technology to obtain the coefficient of correlation r. (Round your answer to three decimal places.) r =arrow_forwardThe following sample of observations was randomly selected. x 5 3 6 3 4 4 6 8 y 13 15 7 12 13 11 9 5 a. Determine the regression equation.b. Determine the value of ŷ when x is 7arrow_forwardIf a sample of 25 pairs of data yields a correlation coefficient, r, of 0.390 and the scatterplot displays a linear trend, can you use the regression equation to make predictions, assuming your x-values are within the domain of the data set? Choose your answer from the multiple choice answers below A.) Yes, because rcrit = 0.396 and the regression coefficient, r, is less than this value. B.) Yes, because rcrit = 0.381 and the regression coefficient, r, is greater than this value. C.) No, because rcrit = 0.381 and the regression coefficient, r, is greater than this value. D.) No, because rcrit = 0.396 and the regression coefficient, r, is less than this value.arrow_forward
arrow_back_ios
arrow_forward_ios
Recommended textbooks for you
 Glencoe Algebra 1, Student Edition, 9780079039897...AlgebraISBN:9780079039897Author:CarterPublisher:McGraw Hill
 Linear Algebra: A Modern IntroductionAlgebraISBN:9781285463247Author:David PoolePublisher:Cengage Learning
 Functions and Change: A Modeling Approach to Coll...AlgebraISBN:9781337111348Author:Bruce Crauder, Benny Evans, Alan NoellPublisher:Cengage Learning
 College AlgebraAlgebraISBN:9781305115545Author:James Stewart, Lothar Redlin, Saleem WatsonPublisher:Cengage Learning
Glencoe Algebra 1, Student Edition, 9780079039897...
Algebra
ISBN:9780079039897
Author:Carter
Publisher:McGraw Hill
Linear Algebra: A Modern Introduction
Algebra
ISBN:9781285463247
Author:David Poole
Publisher:Cengage Learning
Functions and Change: A Modeling Approach to Coll...
Algebra
ISBN:9781337111348
Author:Bruce Crauder, Benny Evans, Alan Noell
Publisher:Cengage Learning
College Algebra
Algebra
ISBN:9781305115545
Author:James Stewart, Lothar Redlin, Saleem Watson
Publisher:Cengage Learning
Correlation Vs Regression: Difference Between them with definition & Comparison Chart; Author: Key Differences;https://www.youtube.com/watch?v=Ou2QGSJVd0U;License: Standard YouTube License, CC-BY
Correlation and Regression: Concepts with Illustrative examples; Author: LEARN & APPLY : Lean and Six Sigma;https://www.youtube.com/watch?v=xTpHD5WLuoA;License: Standard YouTube License, CC-BY